Sectors hit hard by pandemic are also the ones with highest casual employment
Data: ABS - 6291.0.55.003 - Labour Force, Australia, Detailed
Detailed monthly and quarterly Labour Force Survey data, including hours, regions, families, job search, job duration, casual, industry and occupation.
Read more about the data here: Link
Also, ABS - Business Indicators, Business Impacts of COVID-19
This release provides information on the incidence and nature of impacts due to COVID-19, as experienced by businesses operating in Australia
Read more here: Link
Casual Workforce across Industries
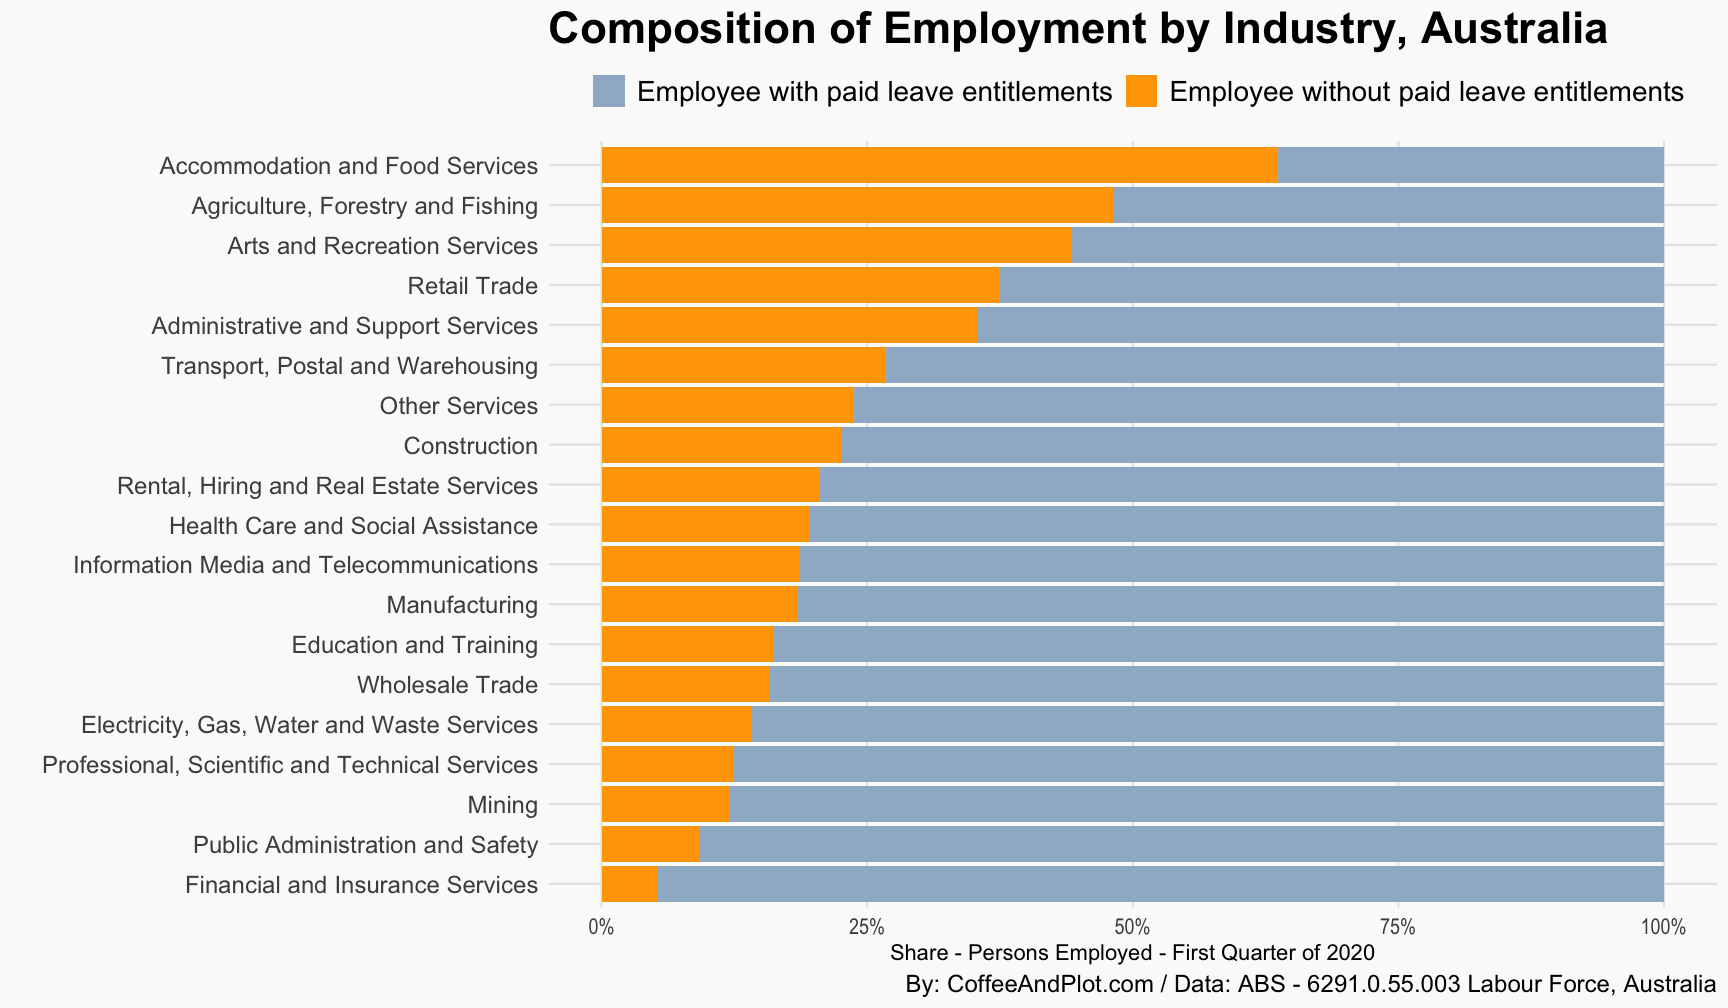
The first figure presents the level of casual employment across different industries at the start of 2020. To identify casual employment, I have separated the workforce (employees) based on their paid leave entitlements. The x-axis shows the share of employees.
As the plot shows, sectors such as accomodation and food services, arts and recreation services and retail, have some of the highest levels of casual employment in Australia. They are also among the sectors being hit the hardest by this pandemic in terms of both supply and demand.
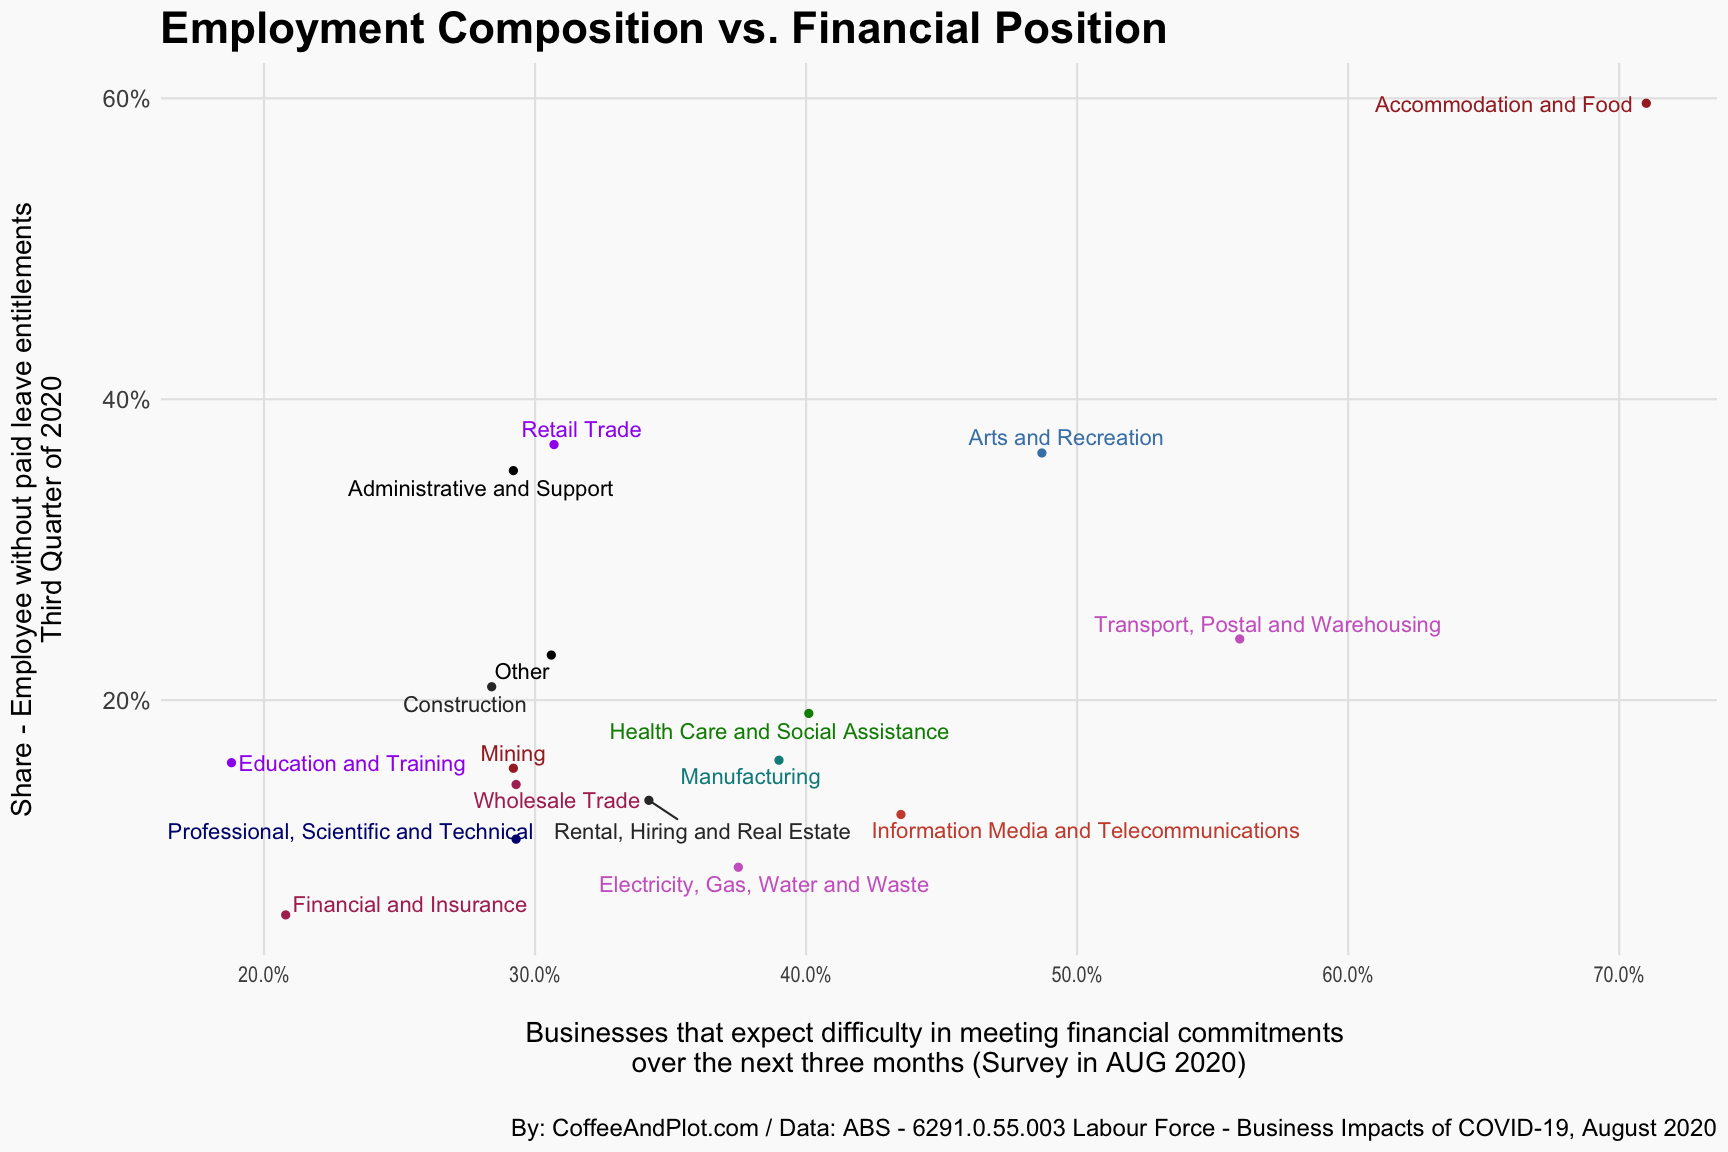
There are different ways to present the impact of Covid-19 on business sectors. I have used data from Business Impacts of COVID-19 Survey, the August release. That survey asks businesses about their expectatoins of difficulty in meeting financial commitments over the next three months.
On y-axis, I have shown the percentage of employees that were in casual employment in the third quarter of 2020. On x-axis, percentage of business that expect difficulty in meeting financial commitments is presented.