Retail turnover slows down across Australia, in Victoria it substantially declines.
Data: ABS - 8501.0 - Retail Trade, Australia
According to the ABS: “This publication presents estimates of the value of turnover of”retail trade" for Australian businesses classified by industry, and by state and territory. The estimates of turnover are compiled from the monthly Retail Business Survey. About 500 ‘large’ businesses are included in the survey every month, while a sample of about 2,700 ‘smaller’ businesses is selected. The ‘large’ business’ contribution of approximately 69% of the total estimate ensures a highly reliable Australian total turnover estimate. Monthly estimates are presented in current price terms. Quarterly chain volume measures at the state and industry levels are updated with the March, June, September and December issues of this publication.
Turnover includes:retail sales; online sales from both store-based and non-store based retailers (except non-employing and non-resident businesses); wholesale sales; takings from repairs, meals and hiring of goods (except for rent, leasing and hiring of land and buildings); commissions from agency activity (e.g. commissions received from collecting dry cleaning, selling lottery tickets, etc.); and from July 2000, the goods and services tax."
Read more about the data here: Link
National Trends
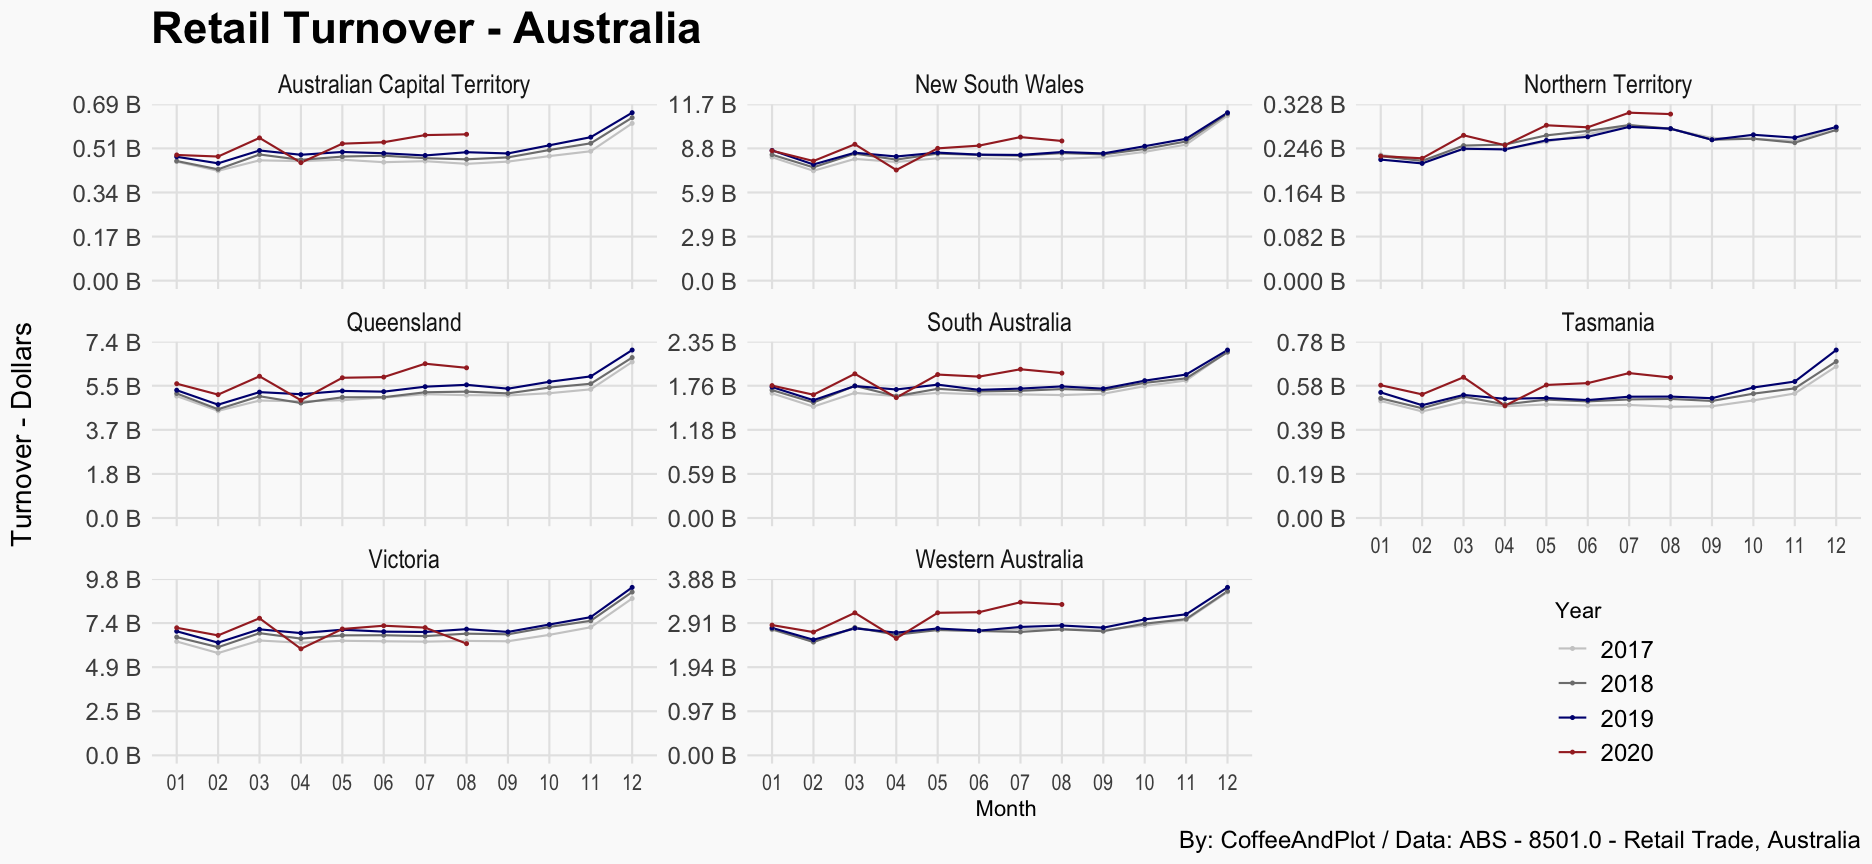
Our first figure presents the total retail turnover across the states and territories. The plot shows that despite the substantial decline in April due to national lockdowns, in August, retail turnover across all states and territories except Victoria has been higher than the last few years. Please notice that these trends are not adjusted for inflation.
However, the increase in turnover that was observed in July did not continue. As the plot shows, except for ACT, retail turnover in August was lower than July for all jurisdictions.
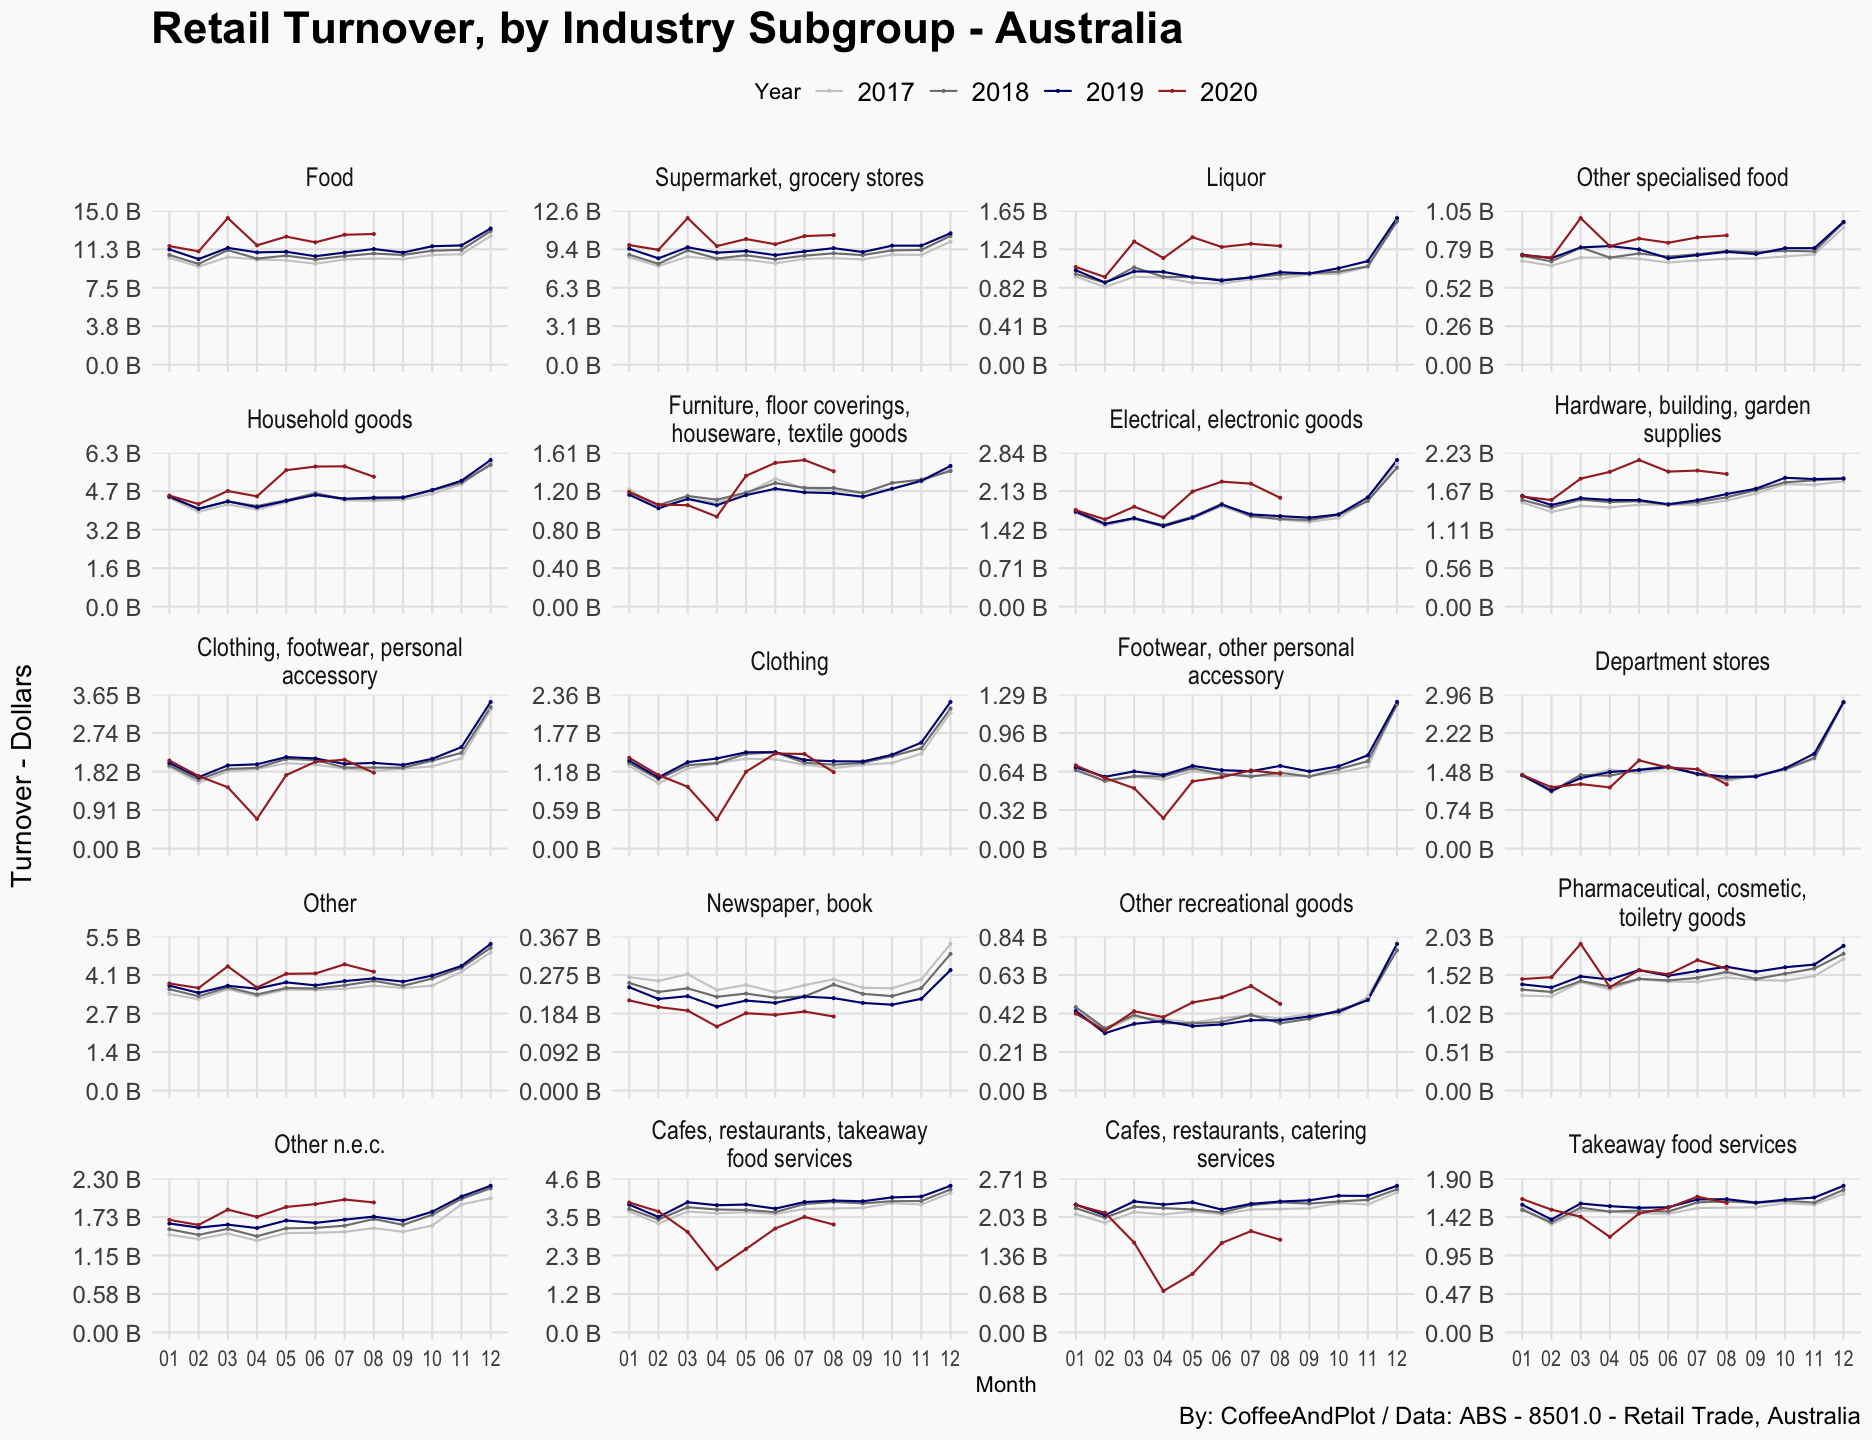
Despite relatively consistent overall patterns, the changes was not uniform across different sectors and industries. The next figure provides a breakdown of the key categories and sub-categories of retail.
As the plot shows, categories such as food (supermarkets, grocery, liquor) and most of household goods have constantly reached higher turnover levels than last year, the impact of panic-buying is evident in March. However, some other categories such as clothing, footwear, and cafes and restaurants have been struggling, some have managed to finally recover in July and August but some still performing at a turnover range much lower than the last year.
Victoria
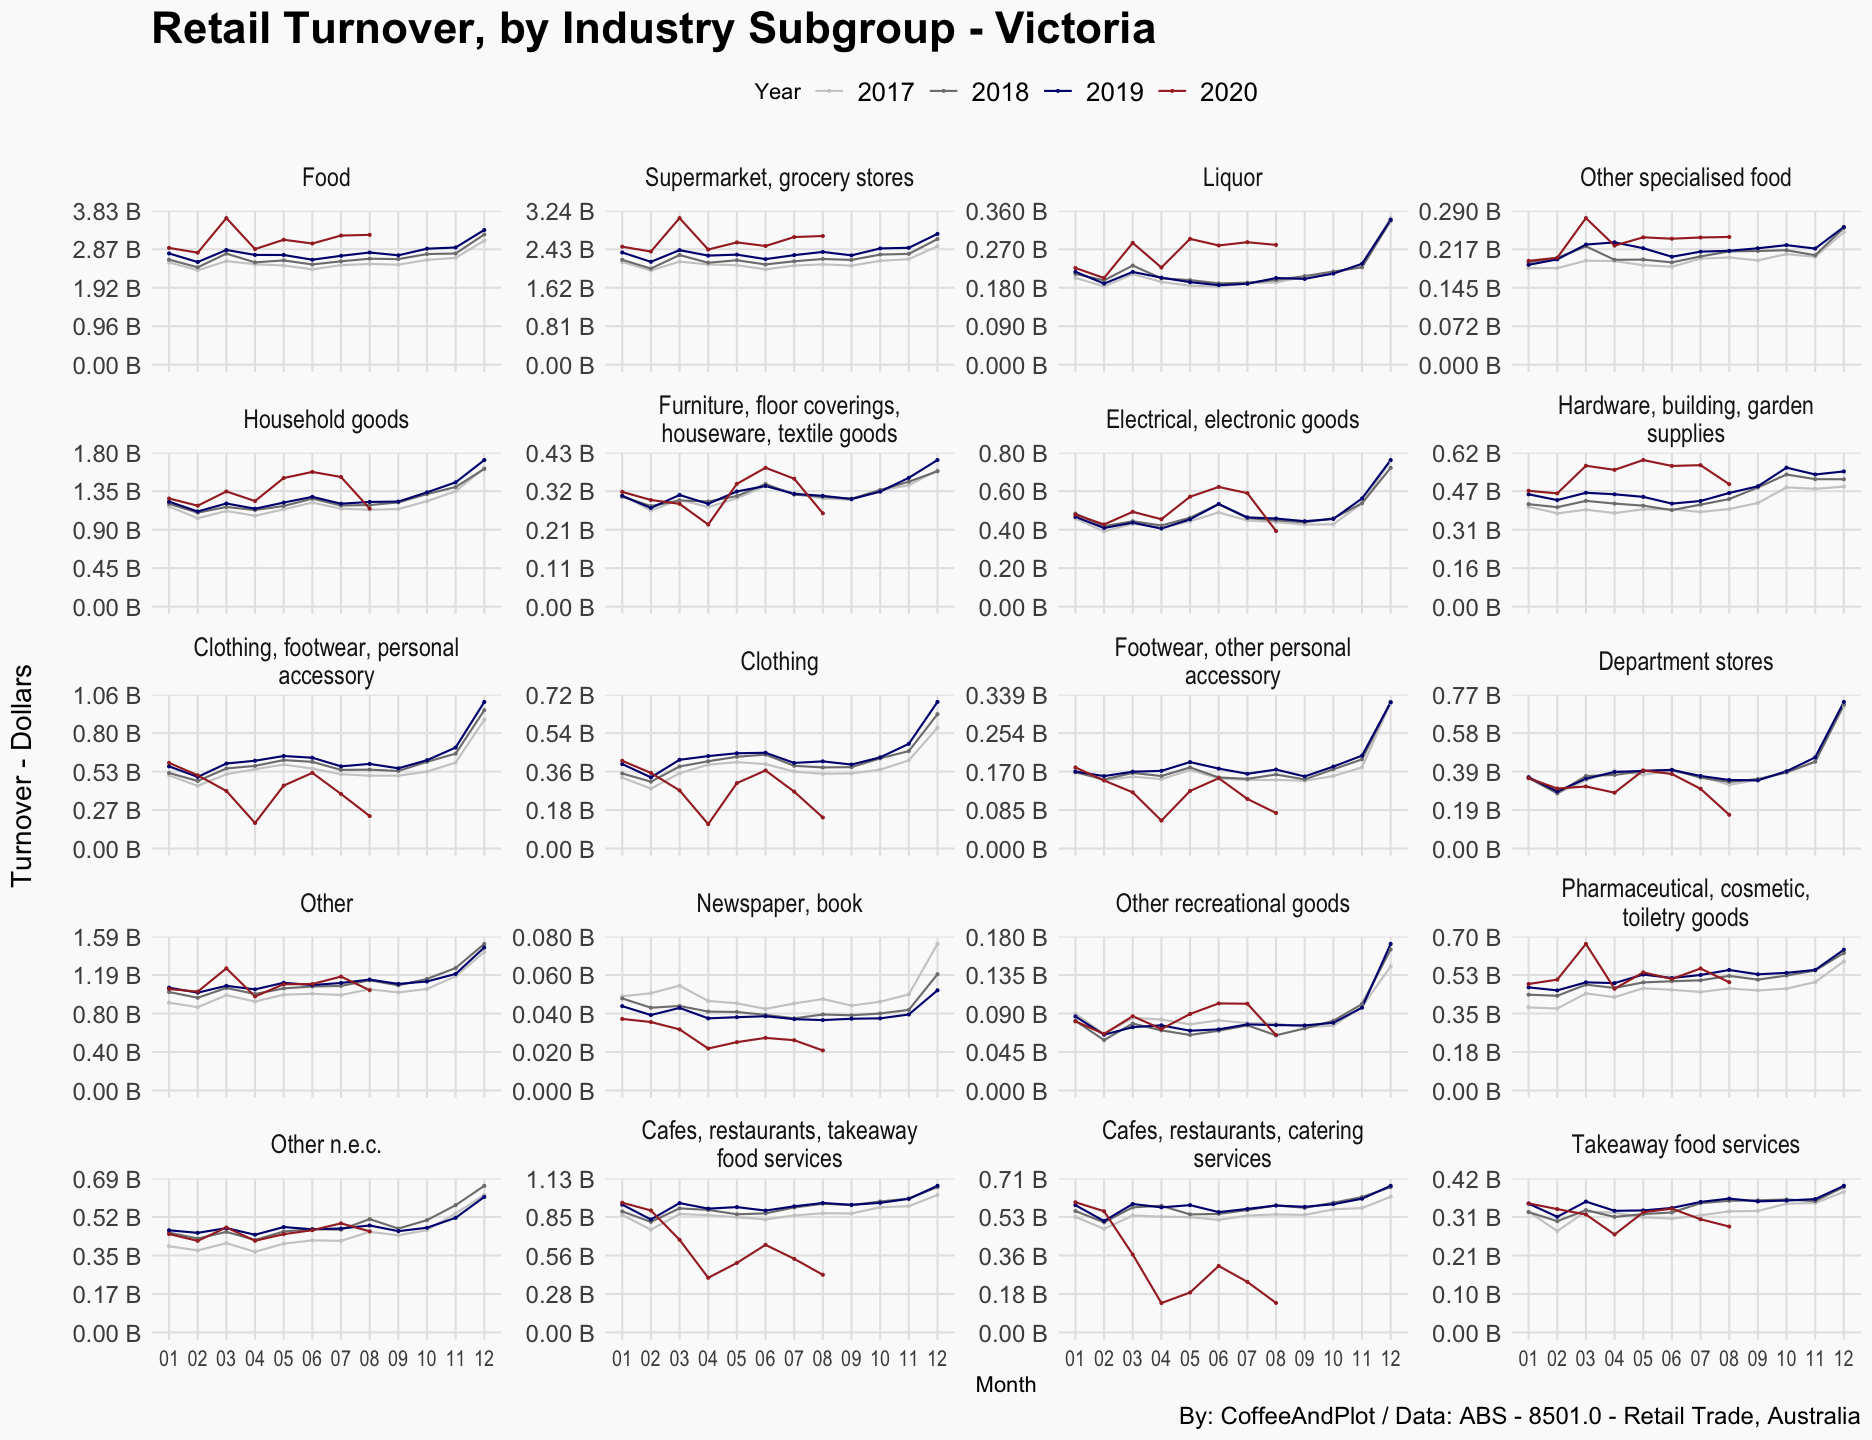
The impact of Stage 4 restrictions in Victoria are now visible in this data. As the plot shows, except for food, liquor, and pharmaceutical, cosmetic and toiletry goods retailing, there was a major decline across all other categories of retail in August 2020, when compared to the same time in previous years.
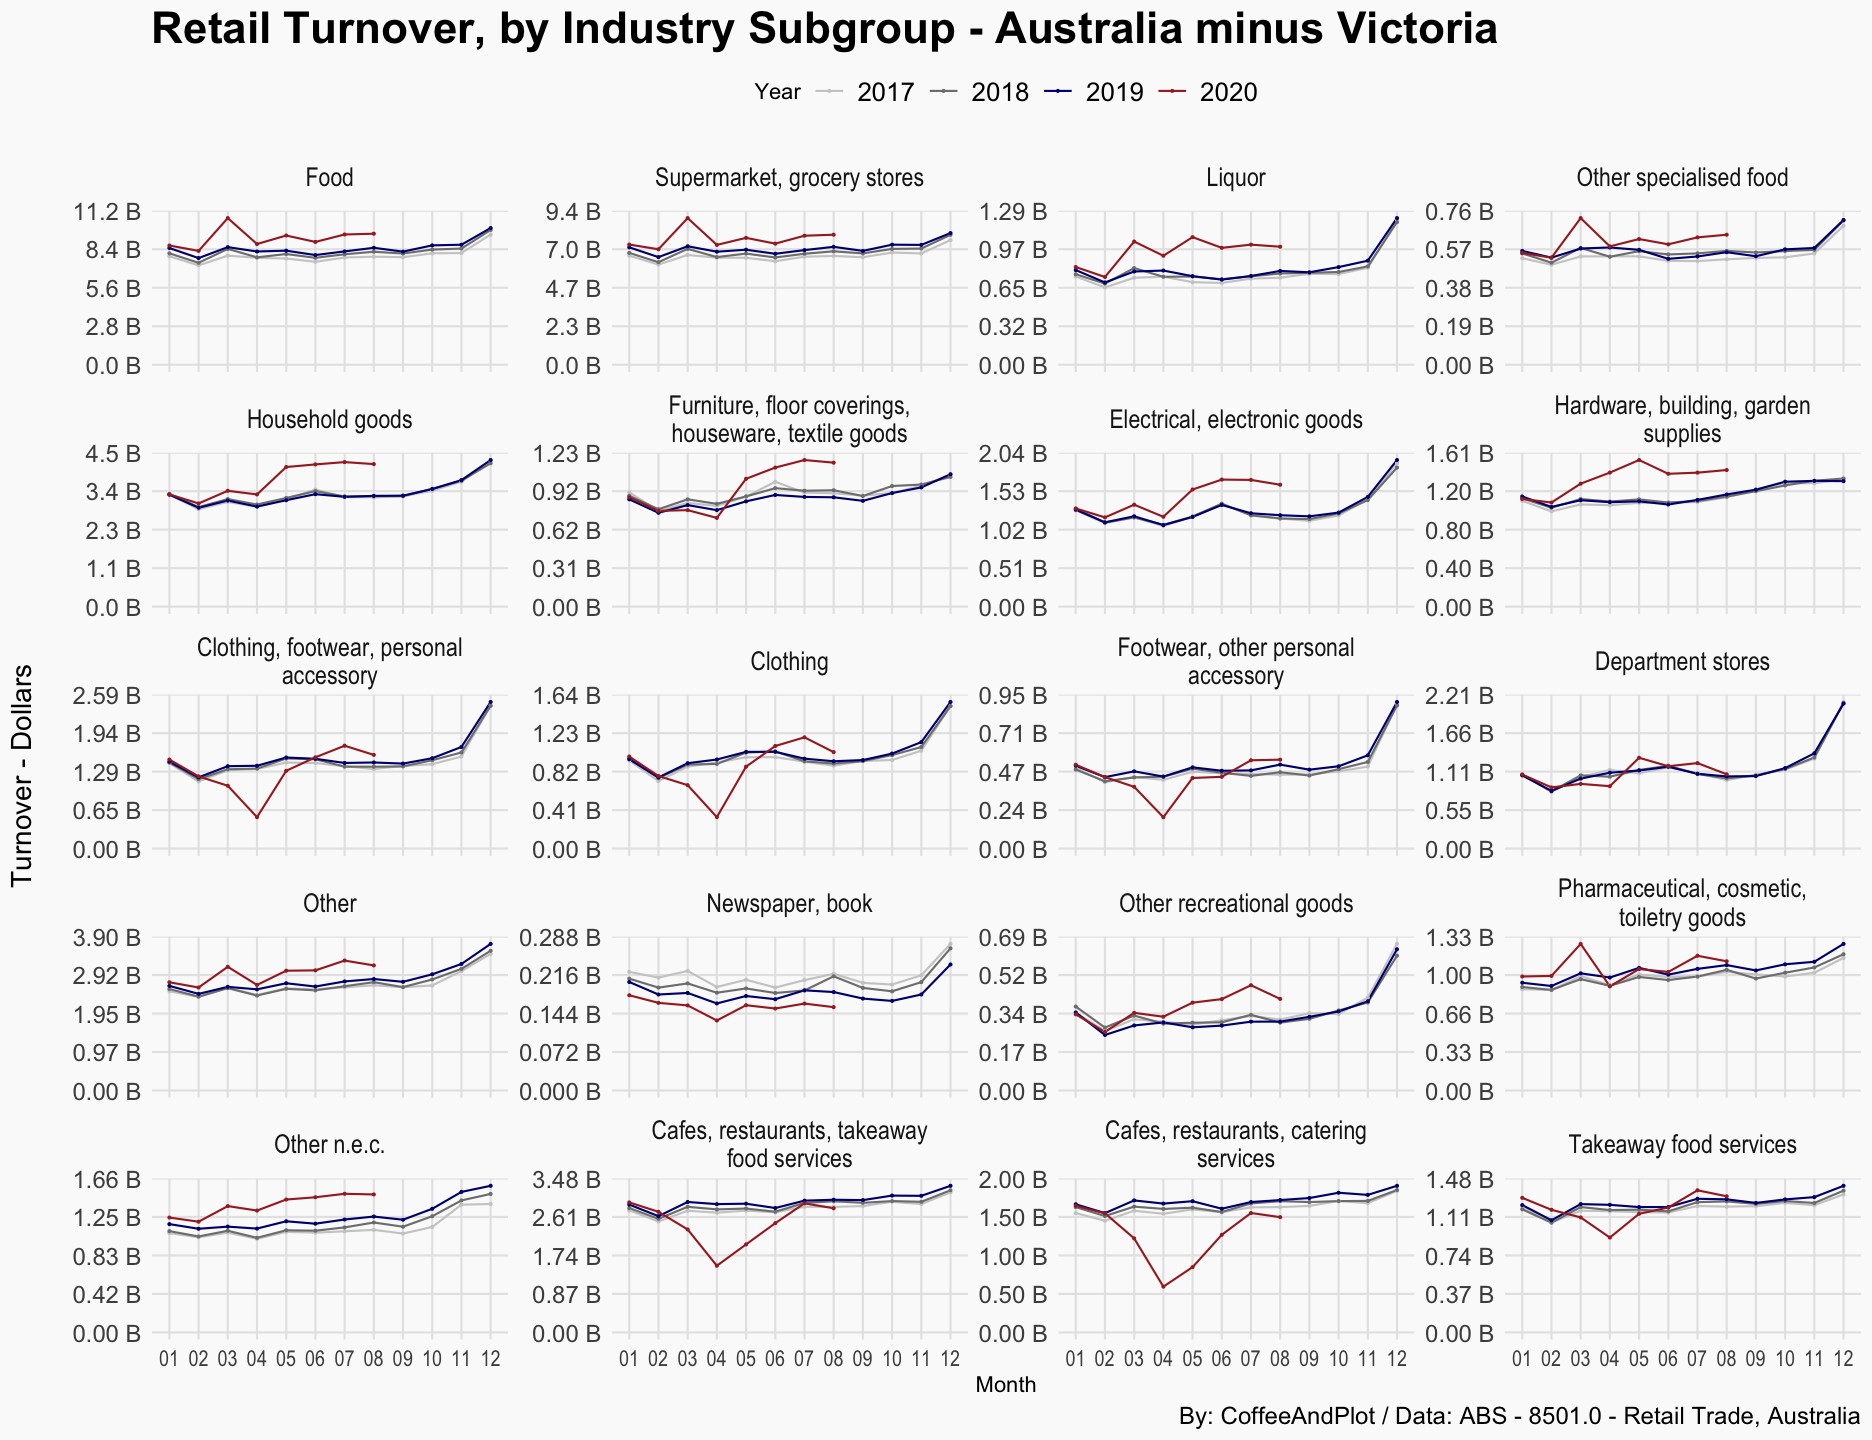
Australia minus Victoria
But the slowdown in retail turnover across the country is not all due to the decline in trends for Victoria. As the next plot shows, if we remove Victoria from the total values, some of the trends still show a downward pattern. For example, shopping for household goods, clothing, footware, and even the trend for department stores declined in August compared to July.