What payroll jobs data tells us about unemplyment and age during this pandemic
App: Payroll Jobs and Wages Index
Visit our Payroll Jobs and Wages Index App and build customised visualisations here: Link
Data: ABS - 6160.0.55.001 - Weekly Payroll Jobs and Wages in Australia
Payroll Jobs Index is collected on a weekly basis and released fortnightly.
According to ABS: “The Australian Taxation Office (ATO) receives payroll information from businesses with Single Touch Payroll (STP) enabled payroll and accounting software each time the business runs its payroll. The ATO provides selected business and job level data items from the STP system to the ABS for the production of statistics.”
“A payroll job is a relationship between an employee and their employing enterprise, where the employee is paid in the reference week through STP-enabled payroll or accounting software and reported to the ATO. Where an employee is paid other than weekly, the established payment pattern is used to include jobs paid in weeks outside the reference week.”
“Employers with 20 or more employees (large employers) commenced transition to STP reporting on 1 July 2018, with approximately 99% of large employers reporting through STP at the time of this release. Employers with less than 20 employees (small employers) began transitioning to STP on 1 July 2019. As such at the beginning of June 2020, approximately 86% of small employers are reporting through STP.”
Read more about the data here: Link
How to read the index?
Estimates are supplied as indexes to provide an indication of movements (rather than level estimates) during the COVID-19 period. In order to compare changes over time, the week Australia recorded its 100th confirmed coronavirus case (i.e. week ending 14th March 2020) is used as the reference period for constructing the indexes and given an index value of 100.0. To make the plots more readable, we have then converted the value of 100 to zero so the changes in unemployment appear as a percentage change in the plots.
National Trends
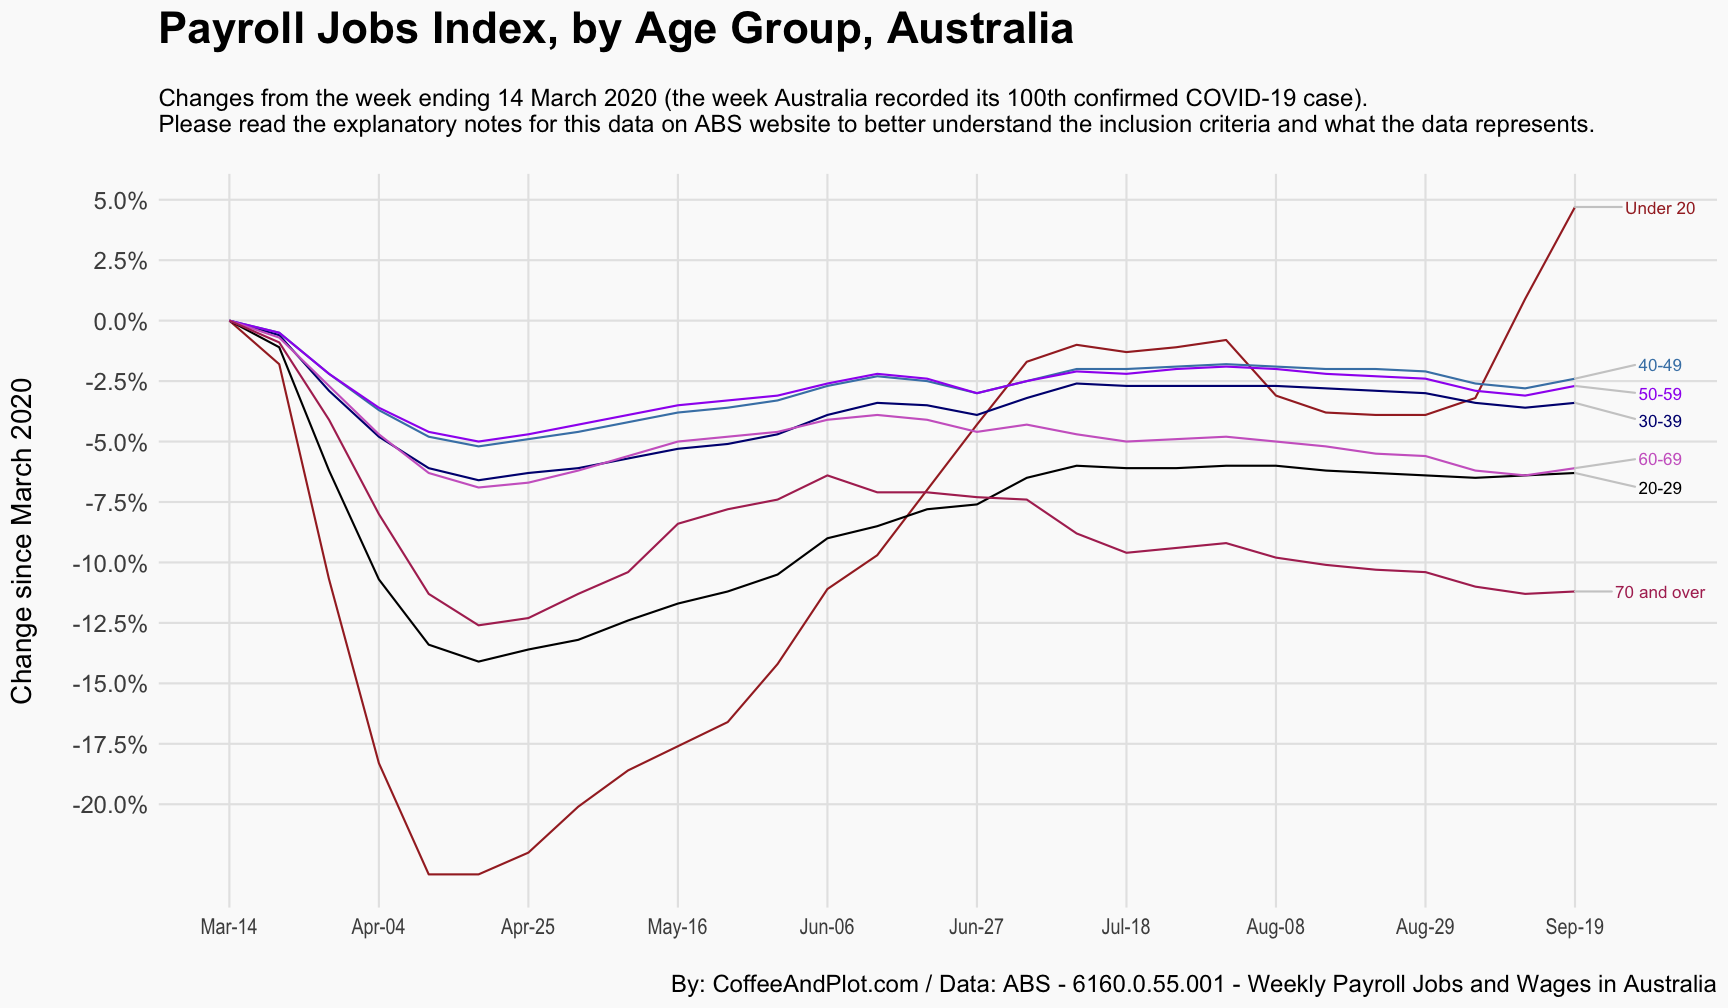
The figure shows the changes in the payroll jobs index since March 2020 across different age groups in Australia. As you can see, the trend for workers under 20 experienced the largest decline during the first wave of Covid-19 and restrictions in Australia. However, it recovered over time and it had a major jump lately in September. One key question is whether this recovery and specially the recent sudden jump is driven by the quality of data or is this really an increase in the number of workers in that cohort. This is specially interesting since this may indicate an substitution across the workforce where the older and more expensive workers are replaced by youger and less expensitve ones who can be paid by government income support programs such as JobKeeper.
The second group hit hardest was workers between 20 to 29 who saw some recovery until July and have experienced a steady trend since then.
However, the figure also shows the trend for workers above 70 is currenrly the only trend with a clear declining pattern following a major decline in March and recovery in June. Please notice that the payroll jobs index does not indicate the size of each cohorts but rather simply compares them with their size in March 2020.
For the 30-59 group the patterns are relatively consistent but across all those groups the recovery seems to be stalled.
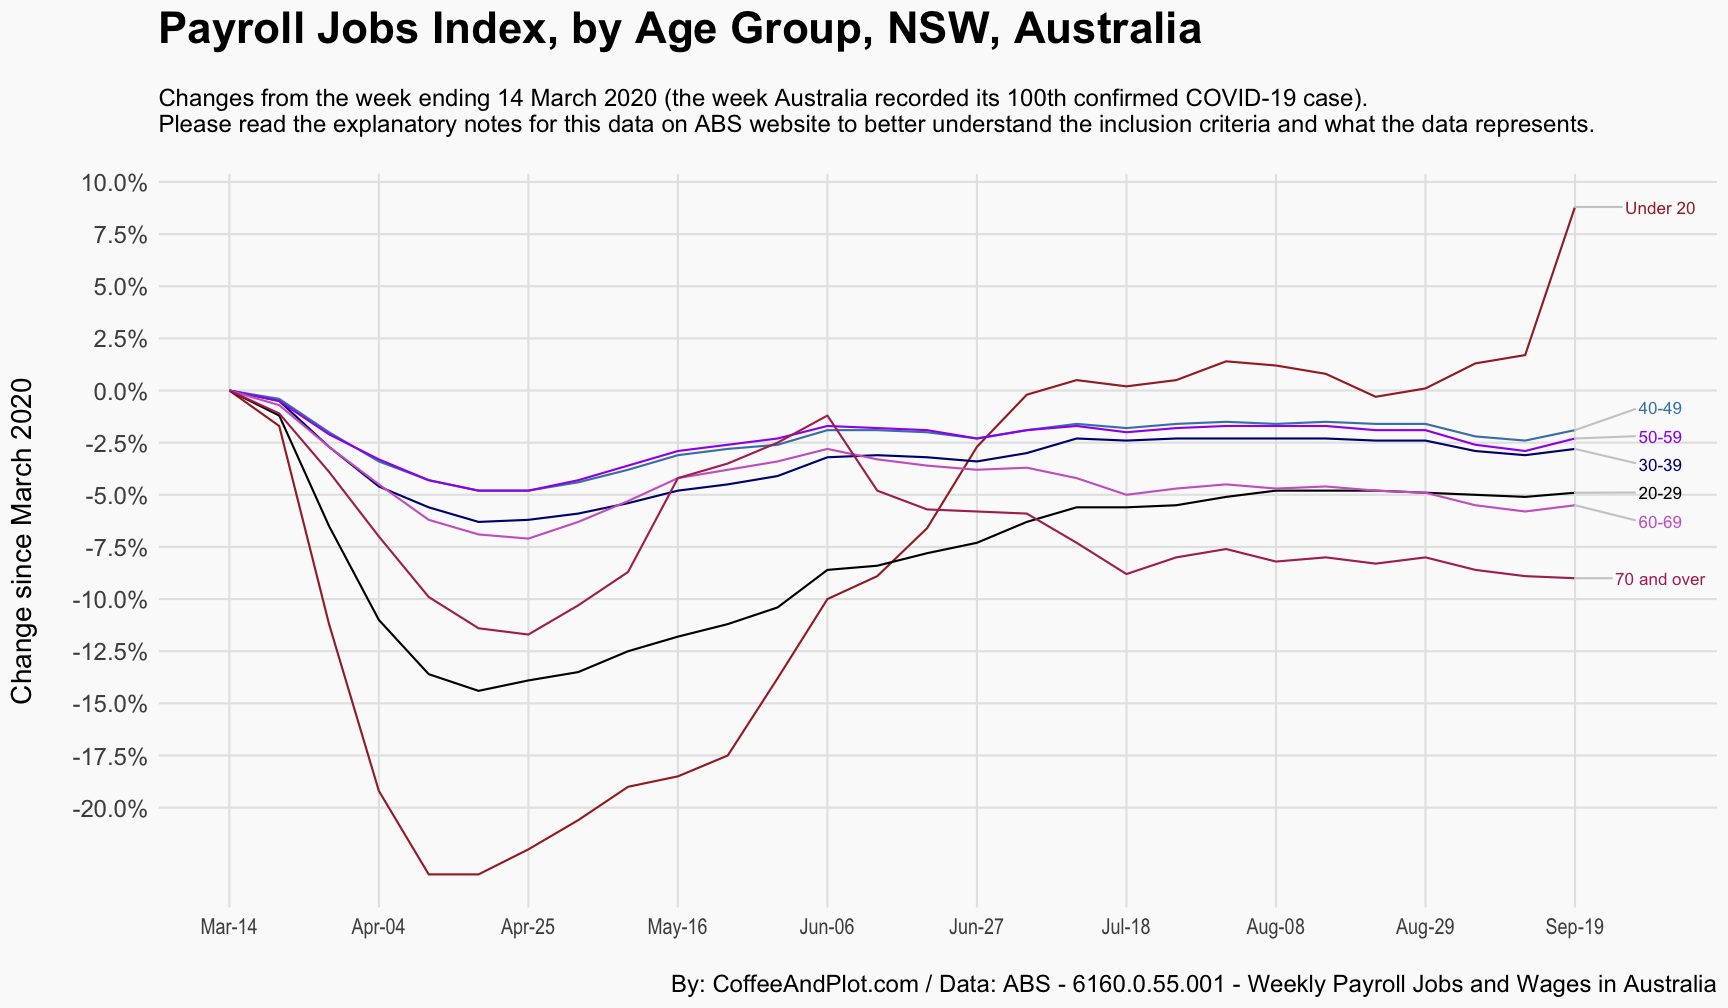
The challenge with the previous graph is that it includes Victoria in the national trends which makes it hard to interpret the patterns. As this is an aggregated index, I cannot remove Victoria and recalculate a new national average. Instead, I have here shown the trends only for NSW as a validation for what we observed in the previous plot.