Energy Sector Leads in Payroll Jobs Index while Arts & Rec, Accomodation and Transport Struggle
App: Payroll Jobs and Wages Index
Visit our Payroll Jobs and Wages Index App and build customised visualisations here: Link
Data: ABS - 6160.0.55.001 - Weekly Payroll Jobs and Wages in Australia
One of the key data sources to monitor the current dynamics of unemployment in Australia is the Payroll Jobs Index. It is collected on a weekly basis and released fortnightly. The only key issue is that you need to well understand what is included in this data and what it represents to be able to make sense of it.
According to ABS: “The Australian Taxation Office (ATO) receives payroll information from businesses with Single Touch Payroll (STP) enabled payroll and accounting software each time the business runs its payroll. The ATO provides selected business and job level data items from the STP system to the ABS for the production of statistics.”
“A payroll job is a relationship between an employee and their employing enterprise, where the employee is paid in the reference week through STP-enabled payroll or accounting software and reported to the ATO. Where an employee is paid other than weekly, the established payment pattern is used to include jobs paid in weeks outside the reference week.”
“Employers with 20 or more employees (large employers) commenced transition to STP reporting on 1 July 2018, with approximately 99% of large employers reporting through STP at the time of this release. Employers with less than 20 employees (small employers) began transitioning to STP on 1 July 2019. As such at the beginning of June 2020, approximately 86% of small employers are reporting through STP.”
Read more about the data here: Link
How to read the index?
Estimates are supplied as indexes to provide an indication of movements (rather than level estimates) during the COVID-19 period. In order to compare changes over time, the week Australia recorded its 100th confirmed coronavirus case (i.e. week ending 14th March 2020) is used as the reference period for constructing the indexes and given an index value of 100.0. To make the plots more readable, we have then converted the value of 100 to zero so the changes in unemployment appear as a percentage change in the plots.
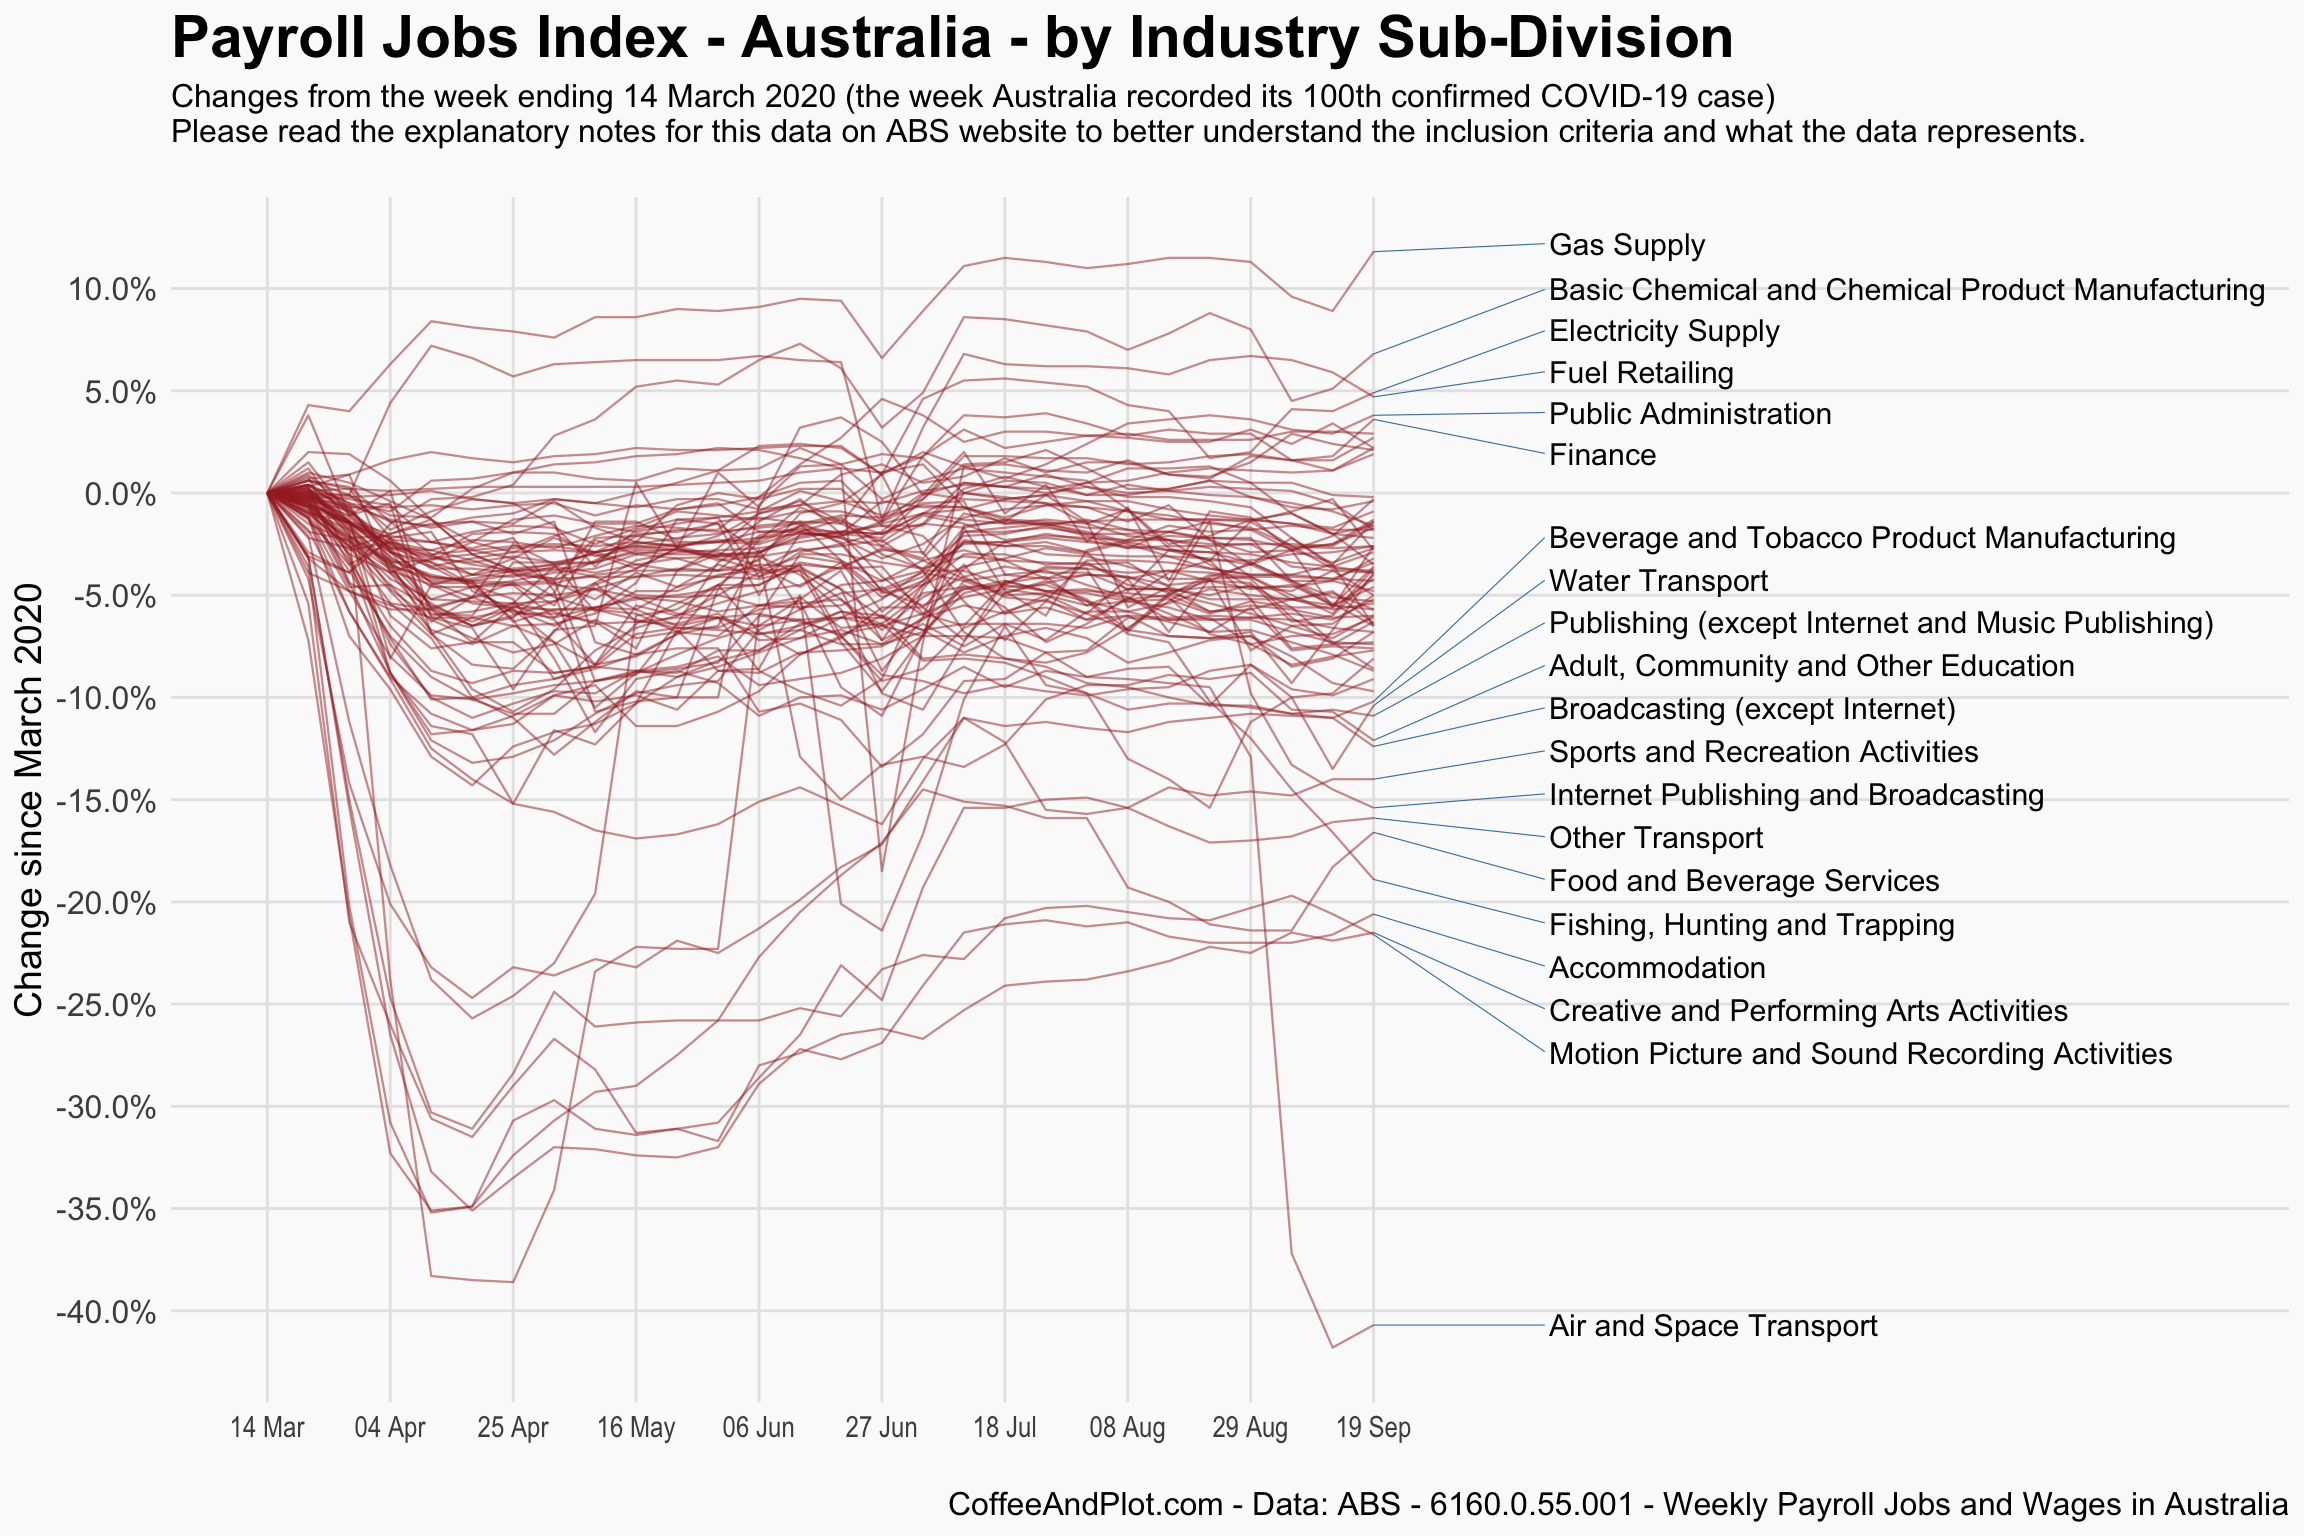
Industry Trends
This plot highlights the best and the worst performers across all industry sub-divisions. As the figure shows, Gas and Electricity Supply, Fuel Retailing and chemicals currently have a payroll jobs index higher than the start of the pandemic (March 2020).
On the other hand, Air and Space Transport services along with other transport activities, multiple sub-industries in arts and recreation services, and food and accomodation have seen a major decline in their employment numbers or are currently recovering slower than other sectors.