Data on Pregnancy Tests Indicates a Slower than Normal Population Growth in Australia in 2020
Data: Medicare Statistics - MBS Item: 73806
You can access data on Medicare service items and groups here: Link
Key things to consider according to Medicare are:
- State/Territory is determined according to the address (at the time of claiming) of the patient to whom the service was rendered.
- Month is determined by the date the service was processed by Services Australia, not the date the service was provided.
- Monthly figures may vary due to the varying number of processing days in a month, which depends on the number of days in the month, public holidays, overtime worked etc.
I have used data on Service Item 73806 which is: Pregnancy test by 1 or more immunochemical methods and you can see the item on Medicare website here: Link
The Trends
There have been lots of conversation on whether the pandemic and its social and economic consequences will lead to faster or slower growth in population. I have been looking into a wide range of measures to identify potential lead indicators of population growth over the last six months. Here, I am sharing one of them and I will write more on this subject here soon.
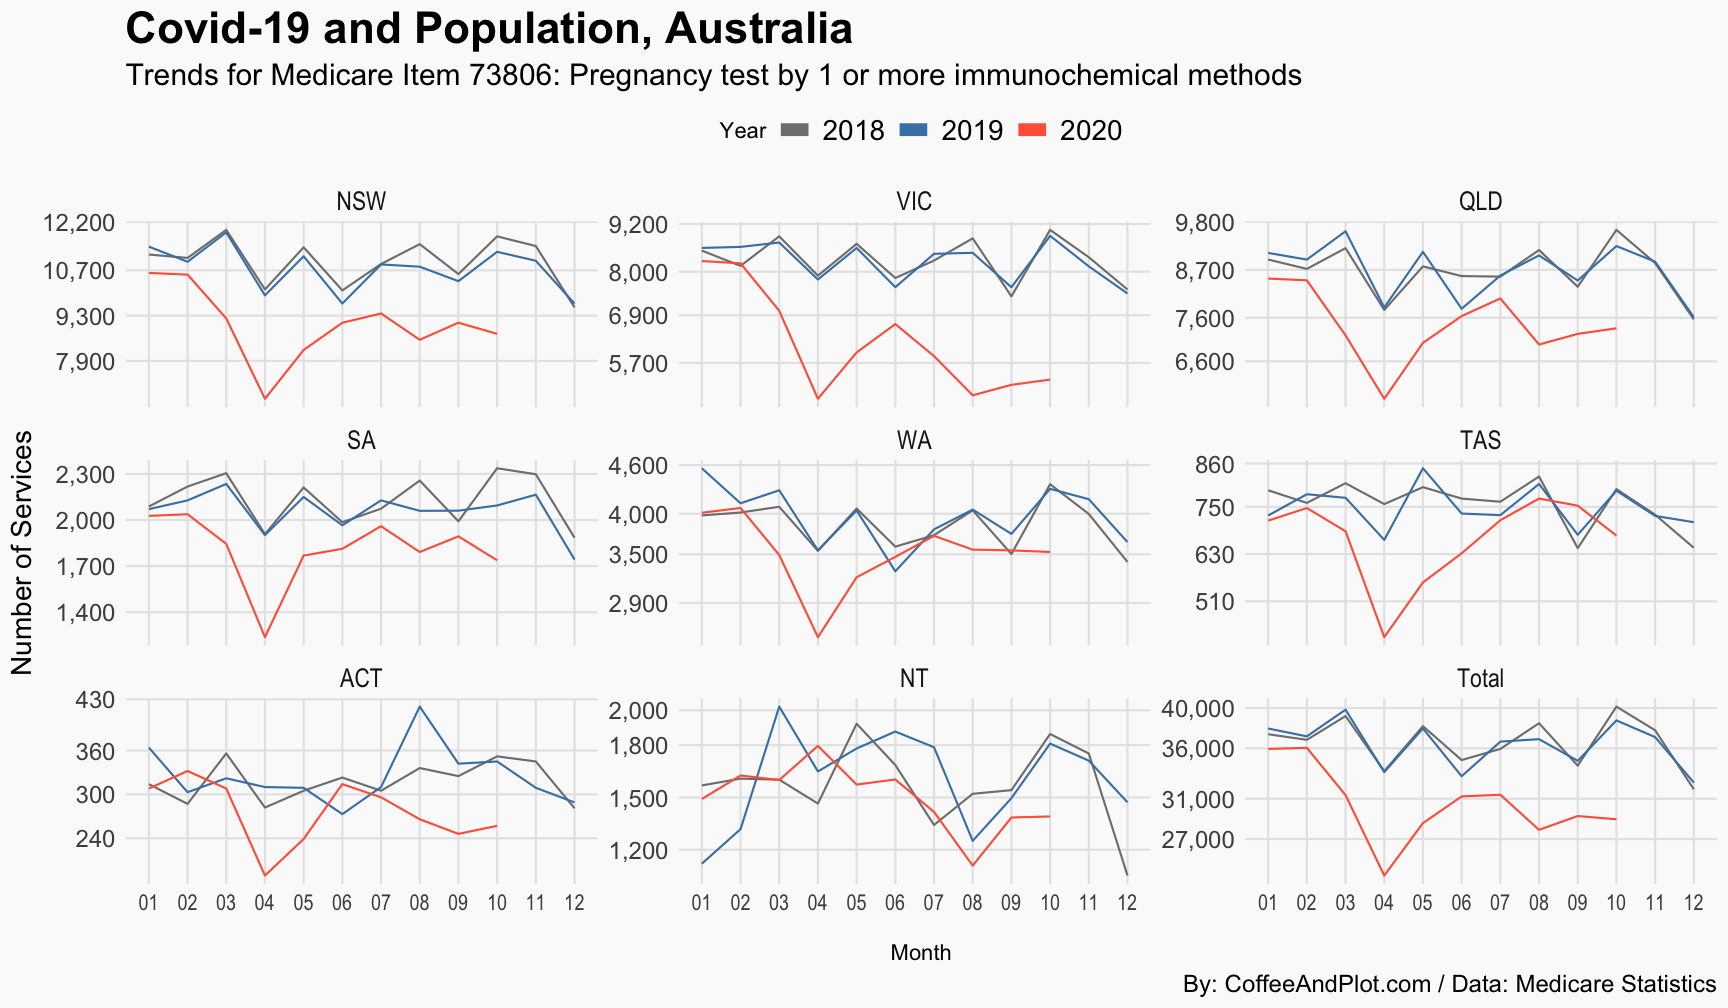
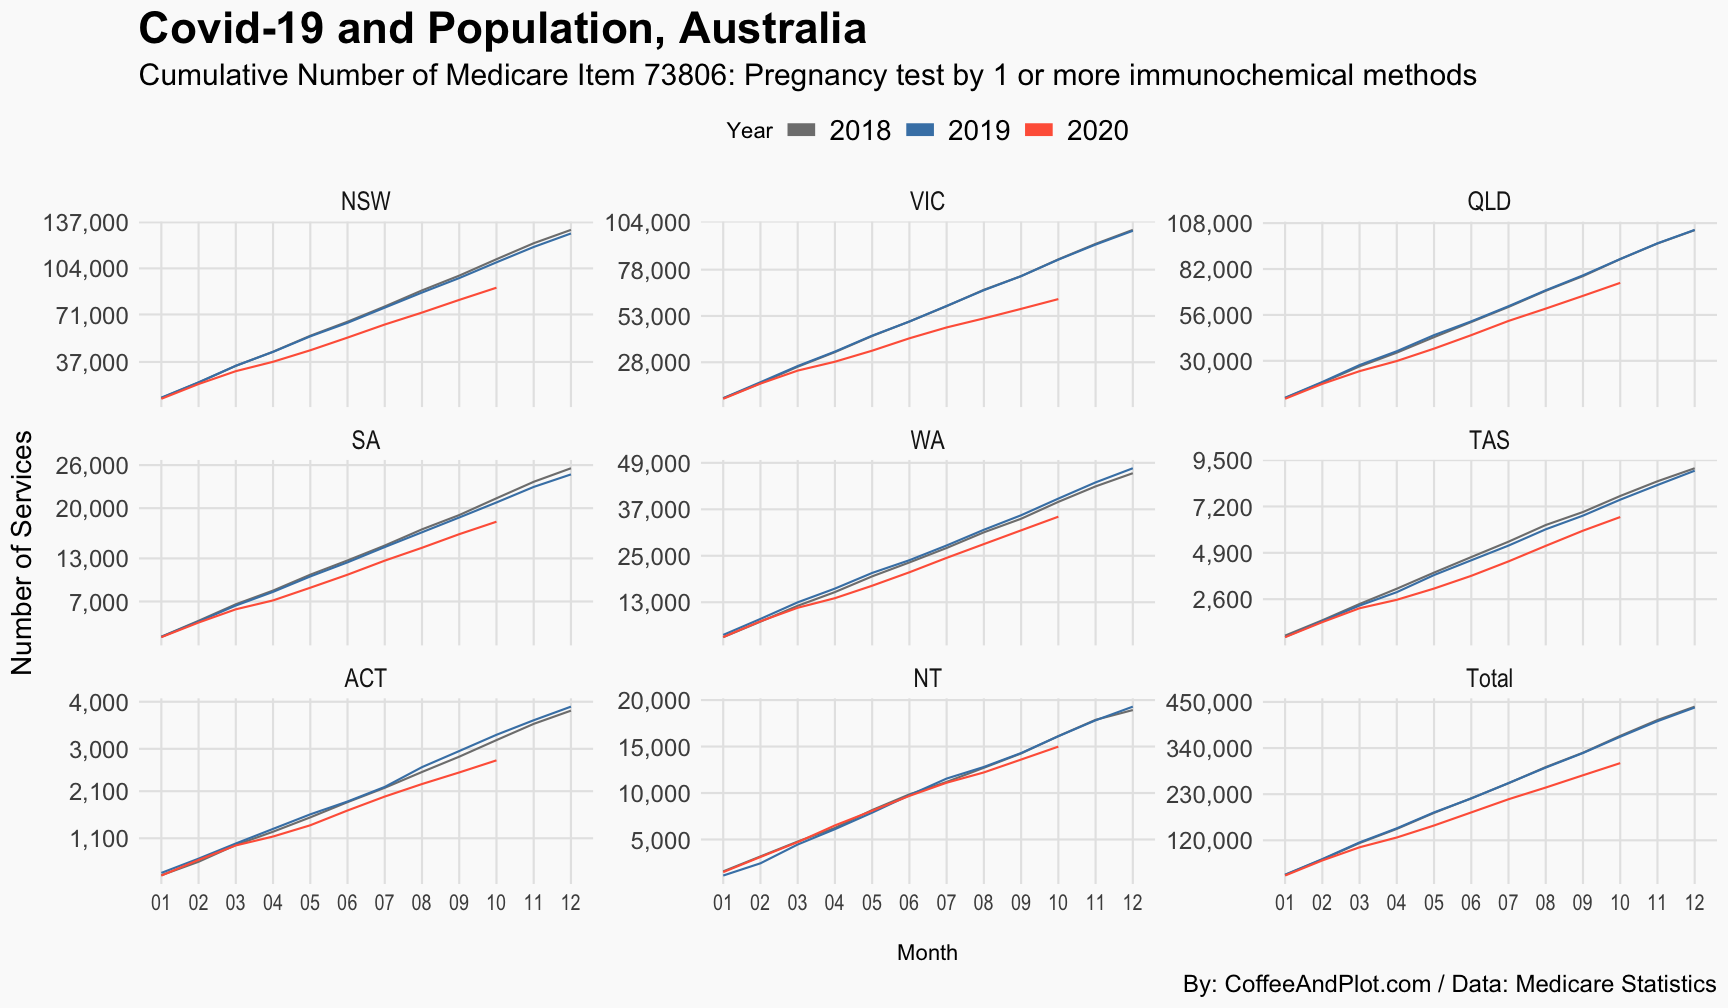
The first plot shows the trends for MBS item 73806 which is a basic pregnancy test covered by Medicare. I have included the full year monthly data for 2018 and 2019 along with data from 2020 until October, which is the latest available data point.
A Caveat
I understand that there will not be a complete correlation between the number of pregnancy tests done and the number of births. Not every pregnancy test means a child will be born and on the other hand a pregnant woman may have more than one test. This article attempts to use the data available to help understand about a phenomenon that otherwise is hard to quantify.
Back to the Trends
According to the figure, WA and TAS seem to be the two jurisdictions where the trend has recovered to its historical level. The ABC published an article recently titled Could Tasmania be having the predicted COVID-19 baby boom?. The article, in line with what you can see in the plot, states that “while the baby boom predicted in the early stages of the COVID-19 lockdown in Australia may not have eventuated, Tasmania seems to be bucking the trend.”
On the other hand, the most populous states in Australia, seem to be experiencing a rather large decline in their test numbers compared to last year. This plot does not help with quantifying the level of decline so let’s look at the data differently.
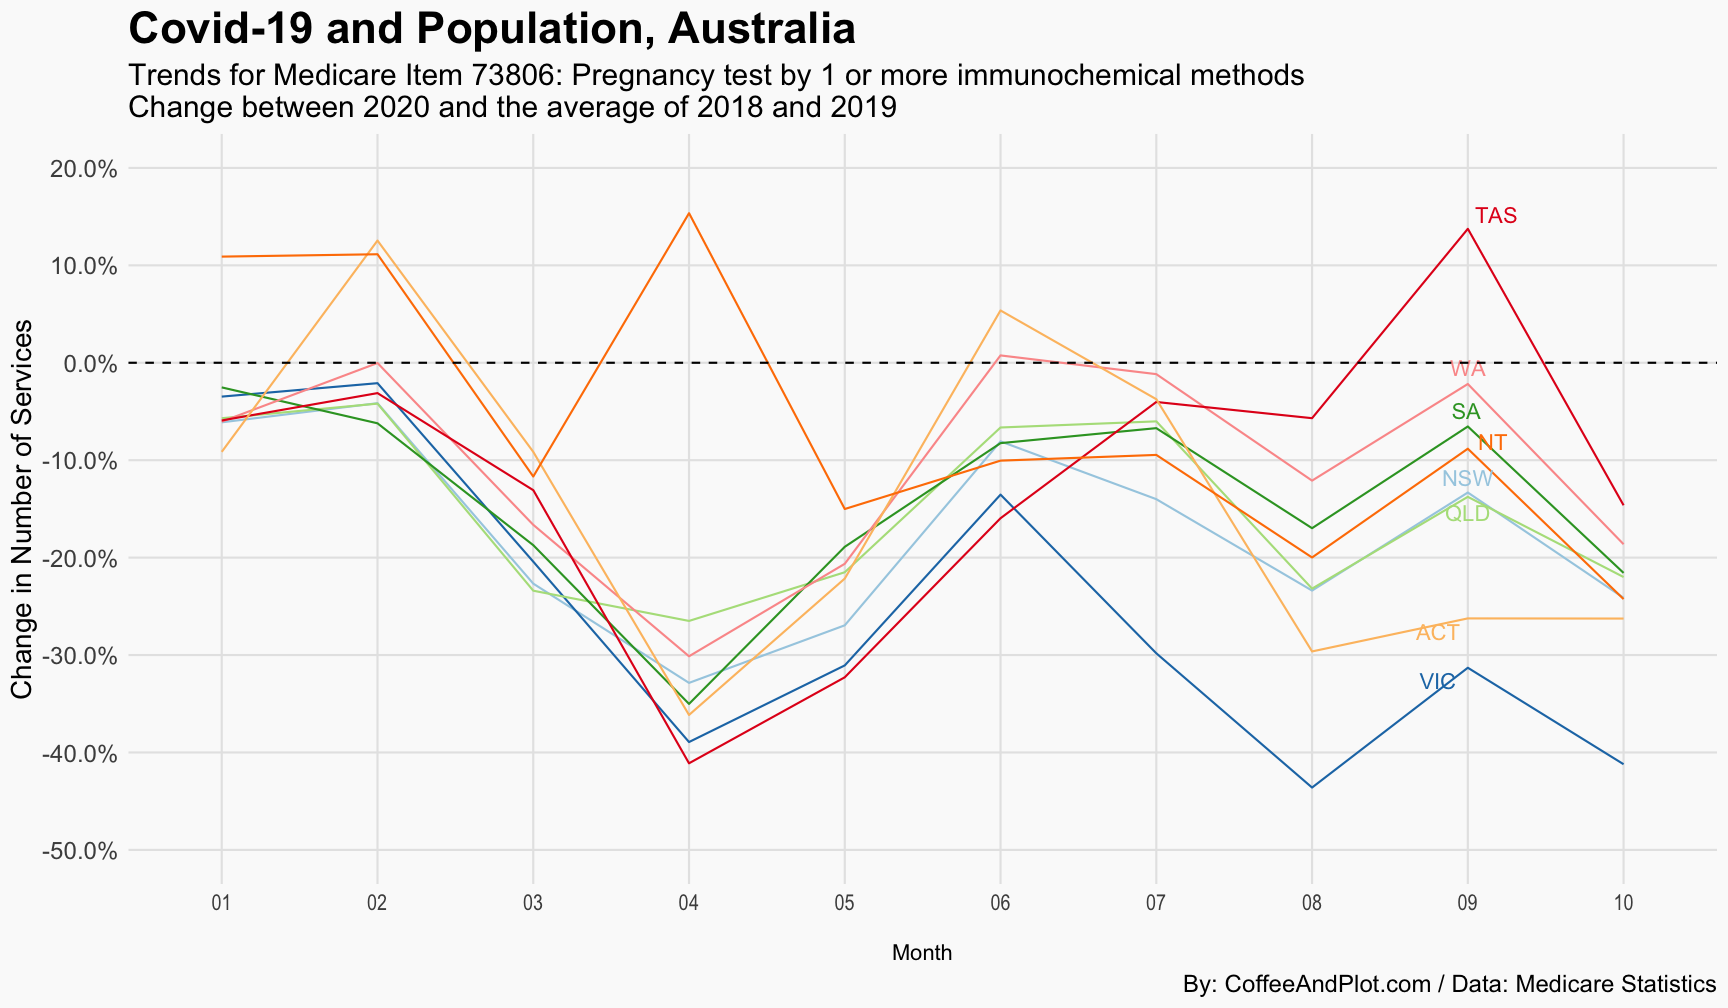
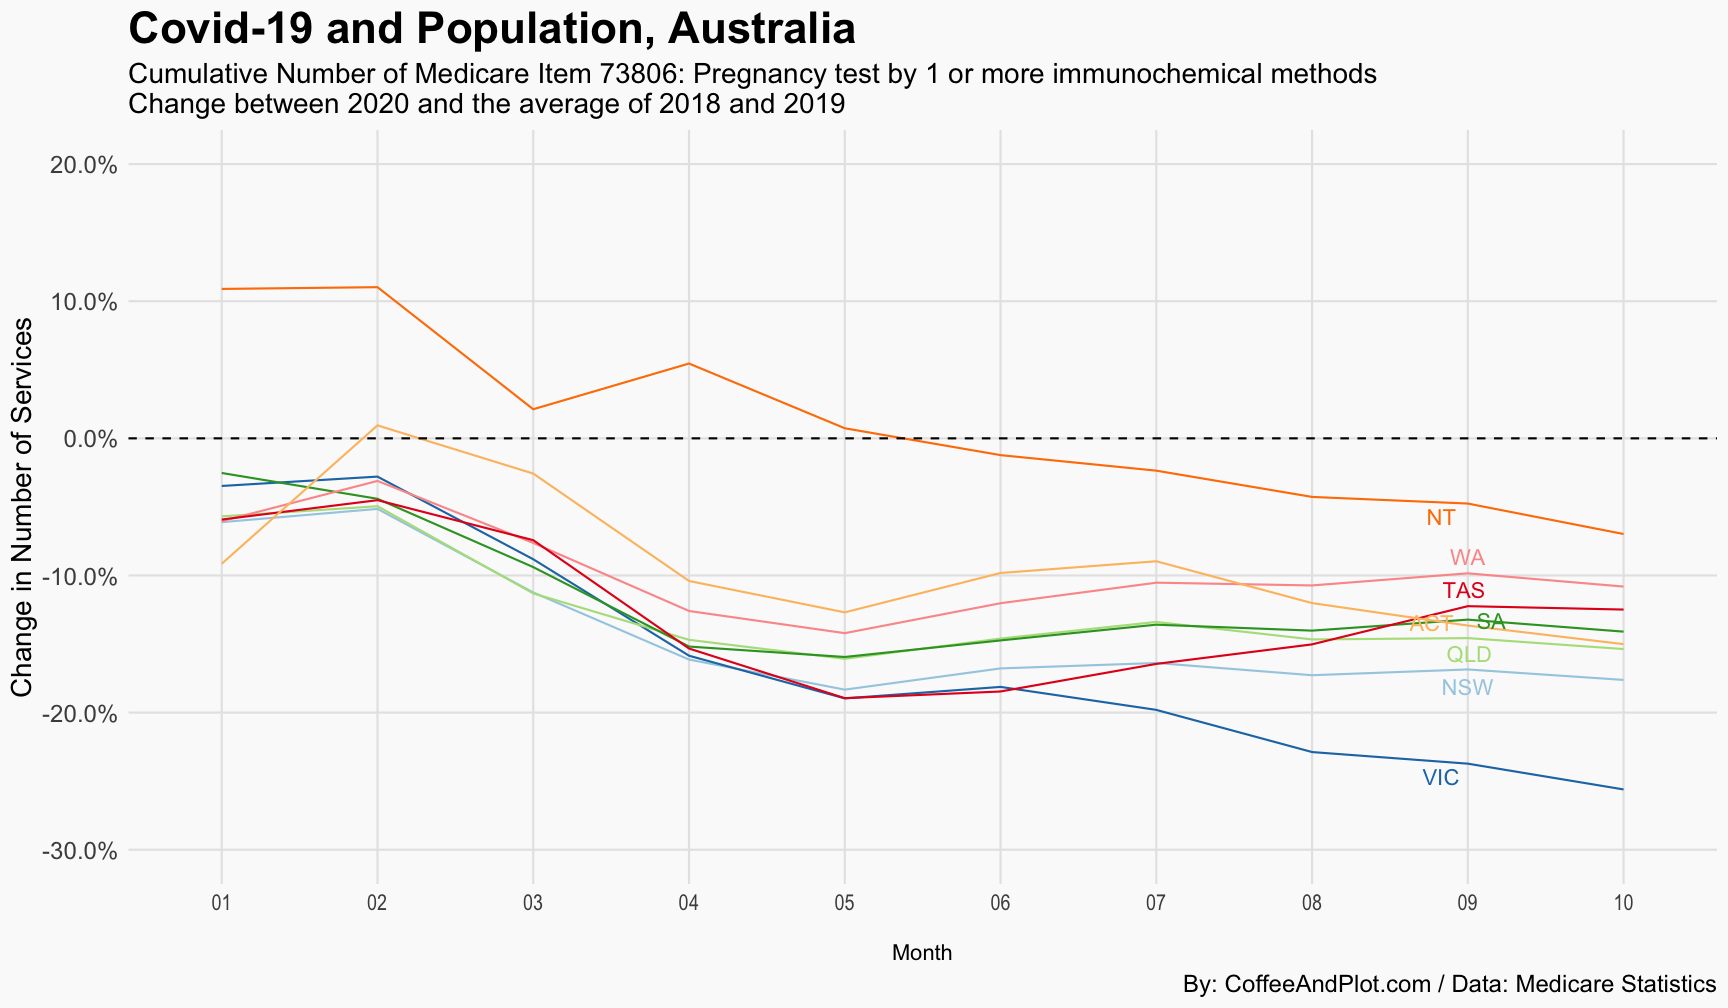
Here, I compare the 2020 pregnancy test numbers with the average of 2018 and 2019 numbers per month. So, for example, if you see the line to be on -5% here, it means that the number the number of pregnancy tests, in that month for that location declined by 5% compared to the average number of tests in the same month and location in 2018 and 2019. The recent increase in the number of tests in Tasmania is well visible here when compared to other jurisdictions across the country.
Of course, some of the decline across the country during the first lockdown (April and May) and then during the second wave in Victoria can be linked to the fact that many were concerned about being exposed to the virus if they visit health providers and so changed their mind or delayed seeking medical services.
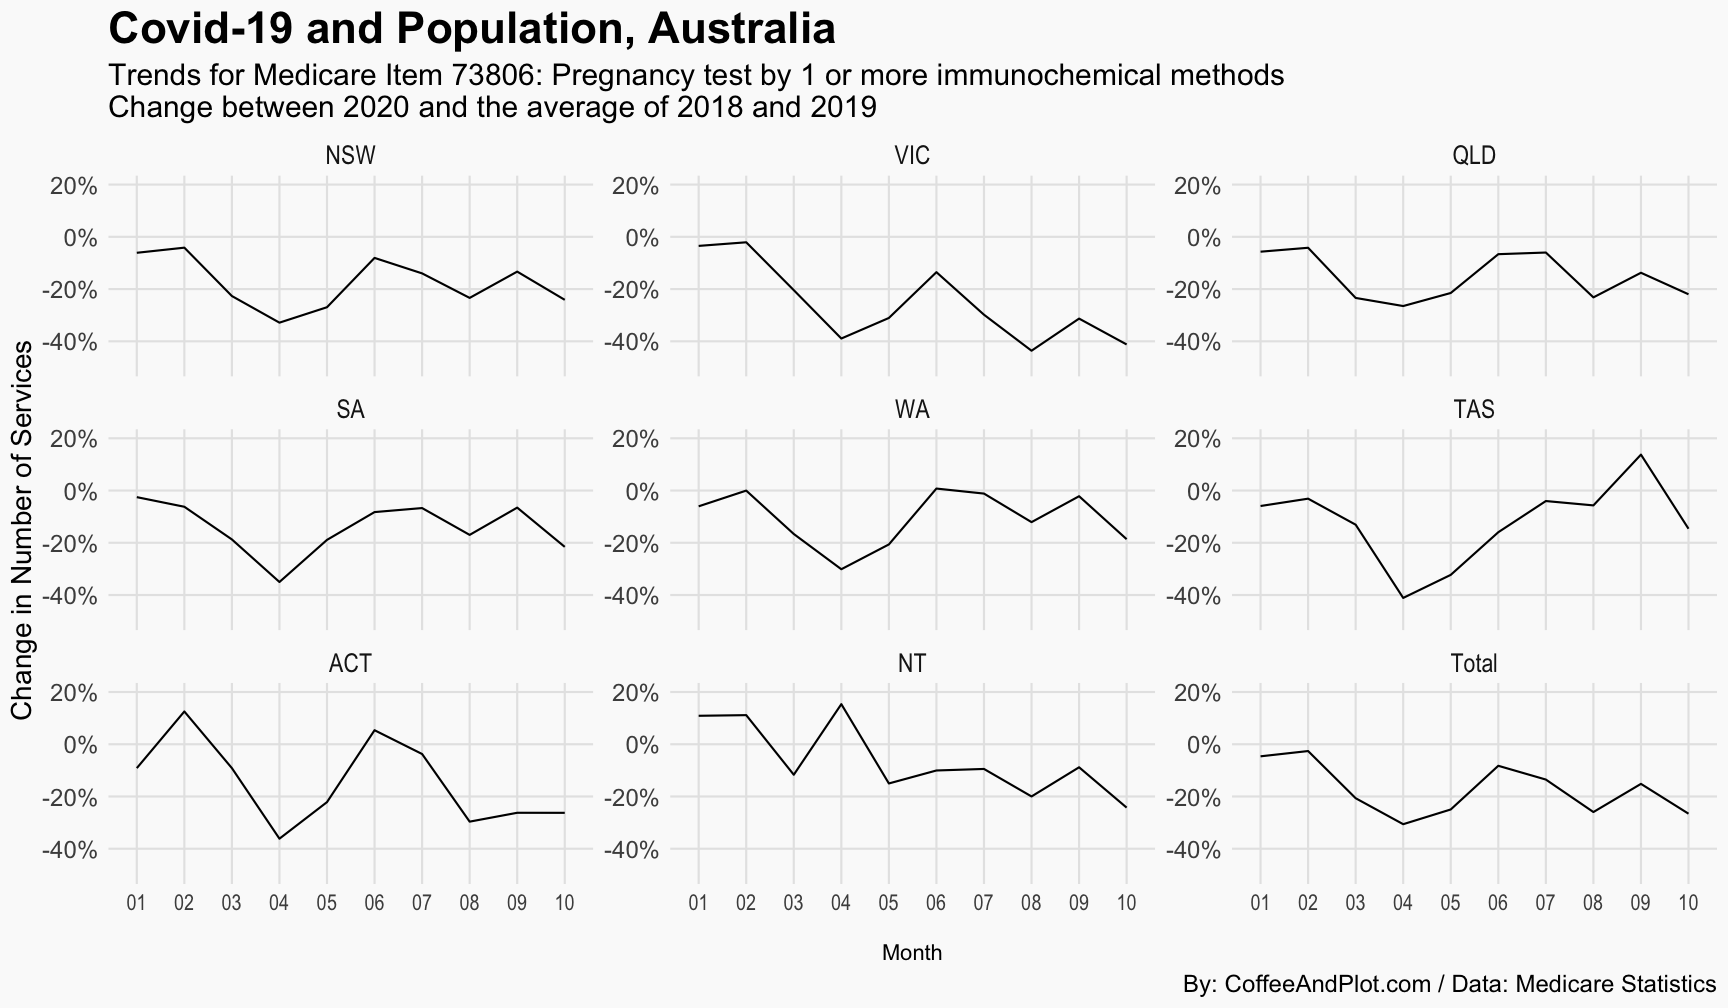
If you want to see those lines separately, here is another version of the same graph.
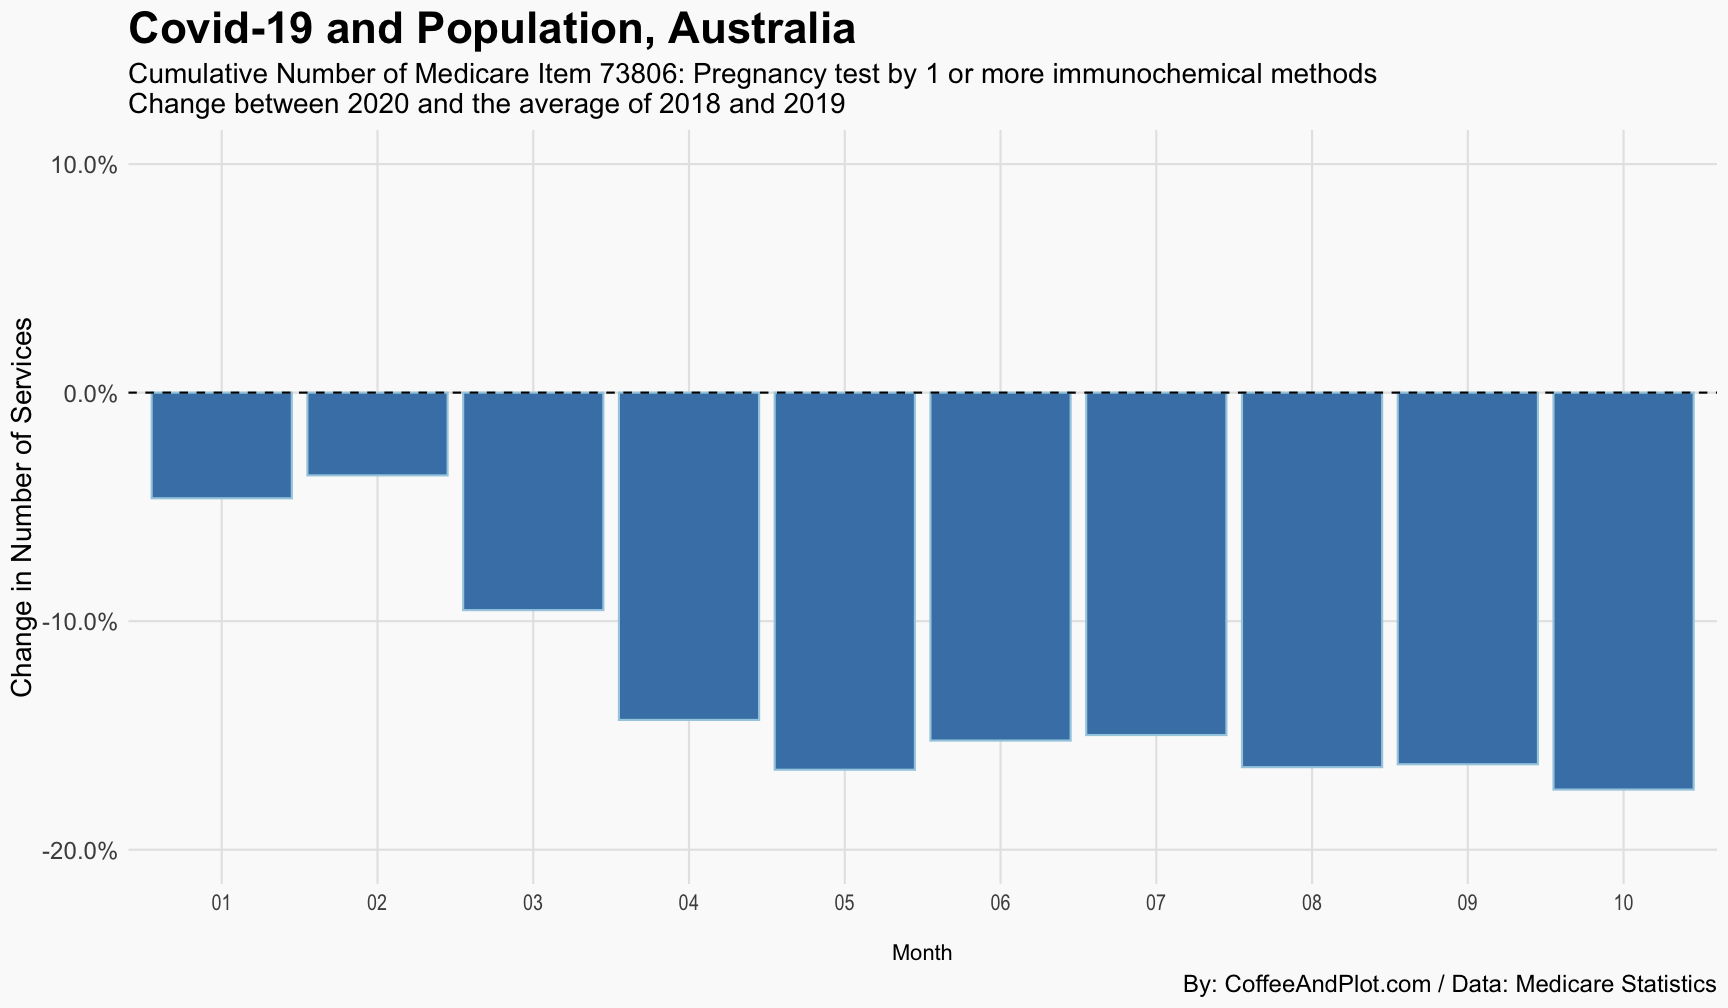
Now, the challenge with the monthly trends is that you cannot easily find out what the overall/cumulative impact is. In the next few plots I will try to give you a full-year perspective into the overall impact of the pandemic on pregnancy tests. First, let’s have a look at a plot that shows the cumulative number of tests over each year.
Next, as we did before, let’s divide the number of tests in 2020 by the average number of tests done in 2018 and 2019. Again, you can see that Tasmania was hit the hardest but is recovering faster than other jurisdictions.
And finally, here is the plot for the total number of tests across the country. So far, this year, there has been a 17.3% decline in the number of pregnancy tests (Item 73806) compared to the average of 2018 and 2019.