Impact of revised AstraZeneca rollout on the vaccination trends in Australia
Last Updated: 2021-05-05 - 04:00 PM
Data: As usual, CovidLive.com.au
What is this post about?
On Thursday, April 8th, the federal government revised its plan and now in Australia, the COVID-19 vaccine by AstraZeneca (AZ) is preferred for adults over 50 years old. In this post, I will try to look at the impact of this change on the vaccination trends since the announcement.
I acknowledge the fact that we only have a few days of data at this stage and I will keep this post updated as more data arrives.
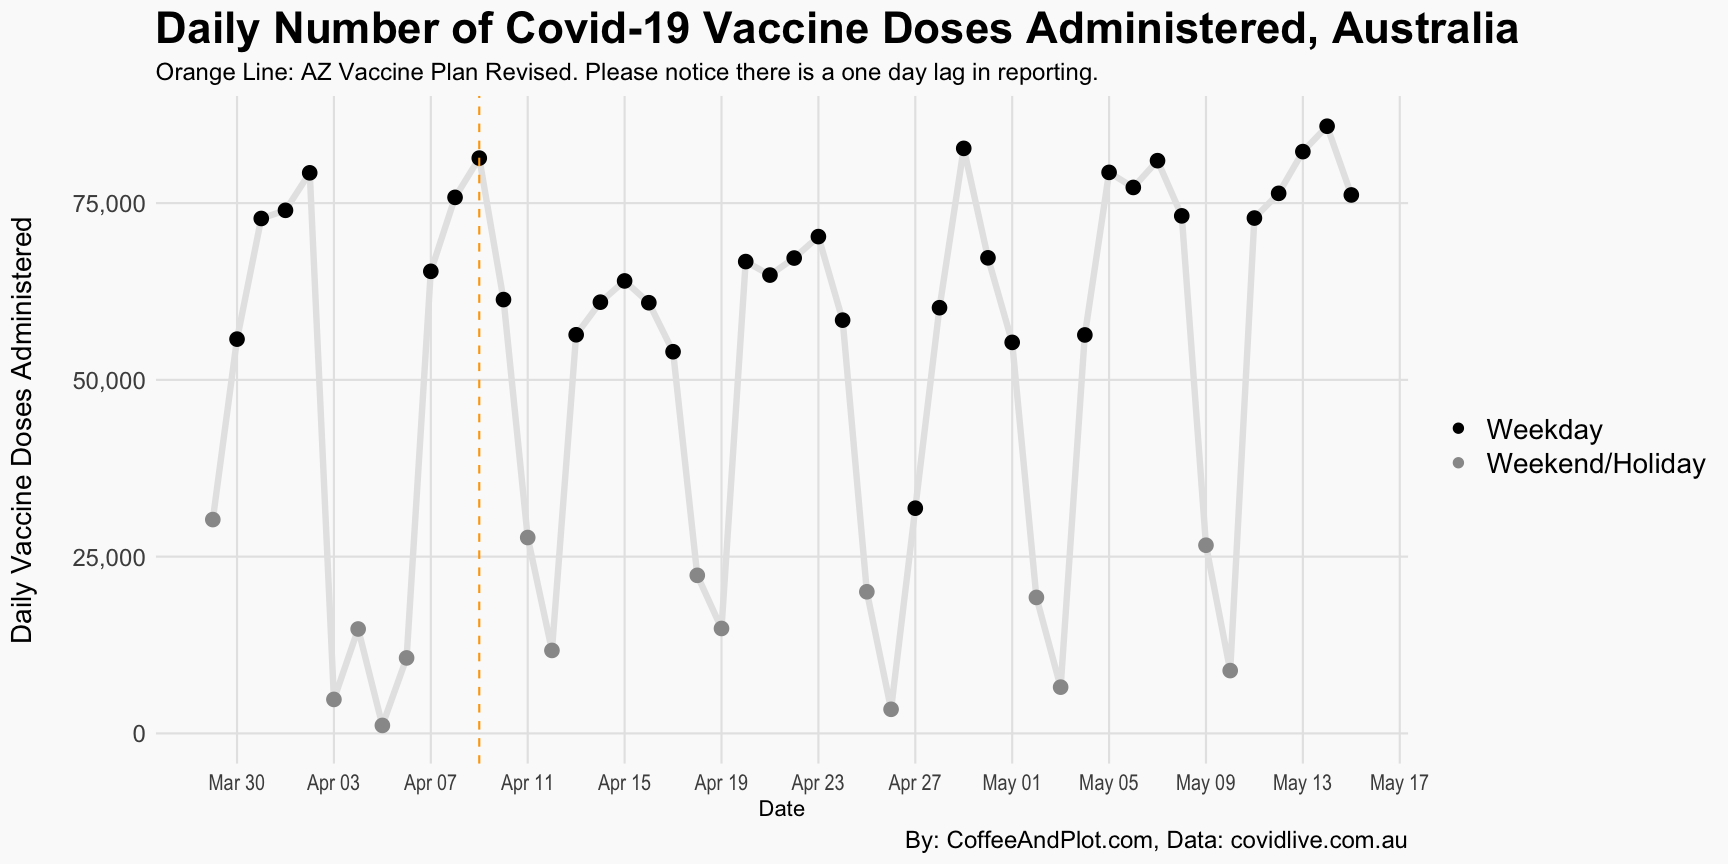
Daily Covid-19 Vaccine Doses Administered, Australia
Let’s look at the first figure where I show the daily doses of vaccines administered across the country. This includes what is reported by states and territories as well as GP clinics and what is called Commonwealth. I am mostly focused on the weekdays since the vaccine numbers during the weekend are very low for the purpose of this analysis.
Prior to the announcement, the average number of vaccines administered was more than 70,000 doses and the maximum daily was around 80,000 in one day. However, in the first week following the revision, each day, only about 60,000 doses of vaccine are administered. If we use 70K to 80K as the range for the vaccination trend prior to the changes to the rollout, this means a 15 to 25% decline in the number of daily doses of vaccines after the changes to the utilization of AZ vaccines.
In the second week, the numbers have improved slightly, but there is still a clear decline in the number of vaccine doses administered.
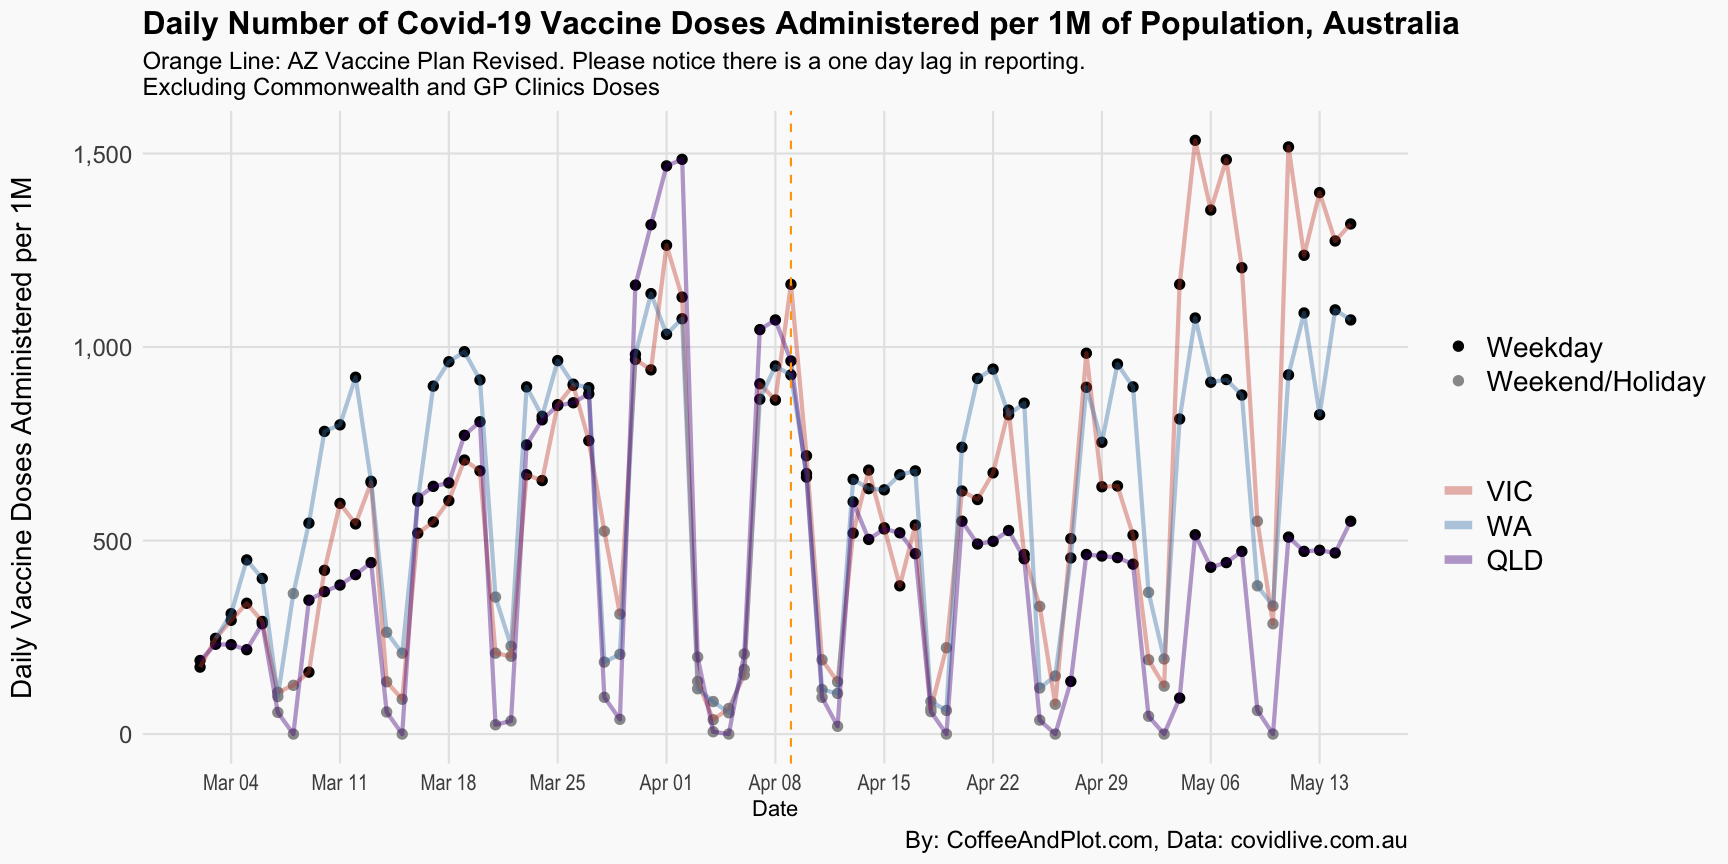
Daily Covid-19 Vaccine Doses Administered, Selected States
Australian states and territories report their own vaccination numbers as well. This number does not include what is done in GP clinics and under the Commonwealth program.
I have selected four states for the second figure so the changes are visible. Please notice that:
1- The numbers are per 1M of people. 2- The spike in NSW numbers at the start of the trend is due to delay in reporting, in other words, they have reported two days of vaccination in one day and hence the zero and then the spike.
As the figure shows, two weeks ago, states were reporting between 1,000 to 1,500 vaccine doses being administered per day per 1M people. Last week this decline to between 750 to 1,000 doses and this week is around 500 to 700 doses per 1M people. Of course, all these numbers are for weekdays.
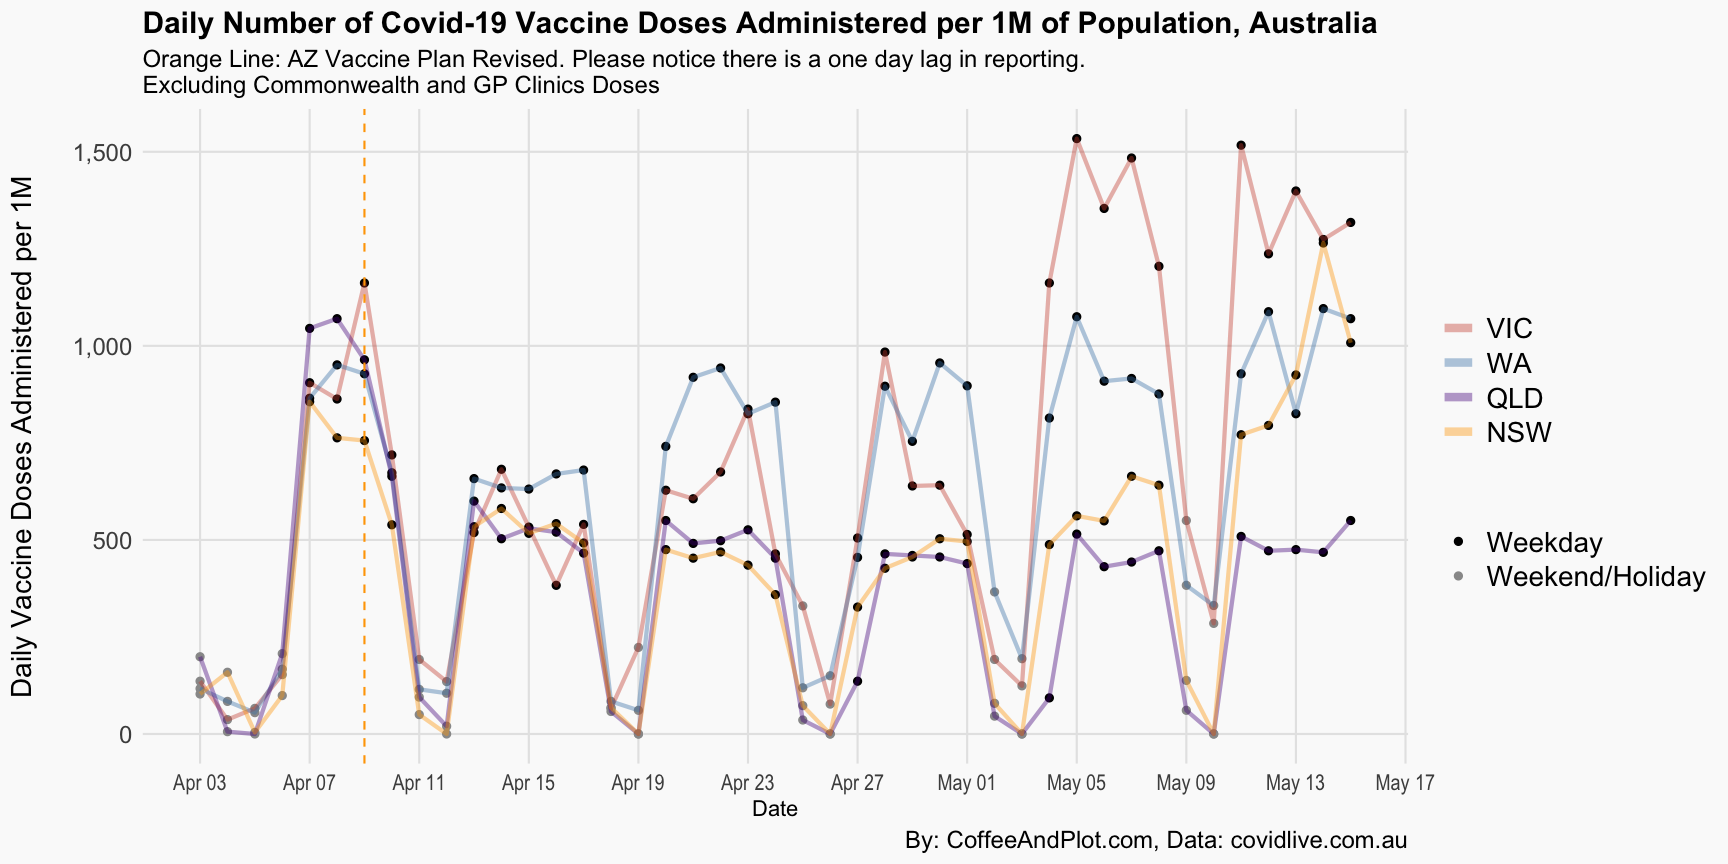
The trend for NSW does not allow to use more data but if I remove NSW and keep the other three states, you can see the vaccination numbers from the first week post changes in the scope of what has been delivered in the four weeks prior to the change and the impact from the changes to the AZ rollout gets clearer. The figure shows that the vaccination numbers in that week were almost lower than any weekday in the last four weeks across all the selected states.