Full-time jobs are not recovering in Australia
Data: ABS - Labour Force, Australia, Detailed, Quarterly (6291.0.55.003)
According to the ABS, “The monthly Labour Force Survey (LFS) provides information about the labour market activity of Australia’s resident civilian population aged 15 years and over. The LFS is designed to primarily provide estimates of employment and unemployment for the whole of Australia and, secondarily, for each state and territory.”
Read more about the data here: Link
National Trends
I have been following the patterns of recovery in employment data for the past few months and this is another short post to share a single plot, but an important one.
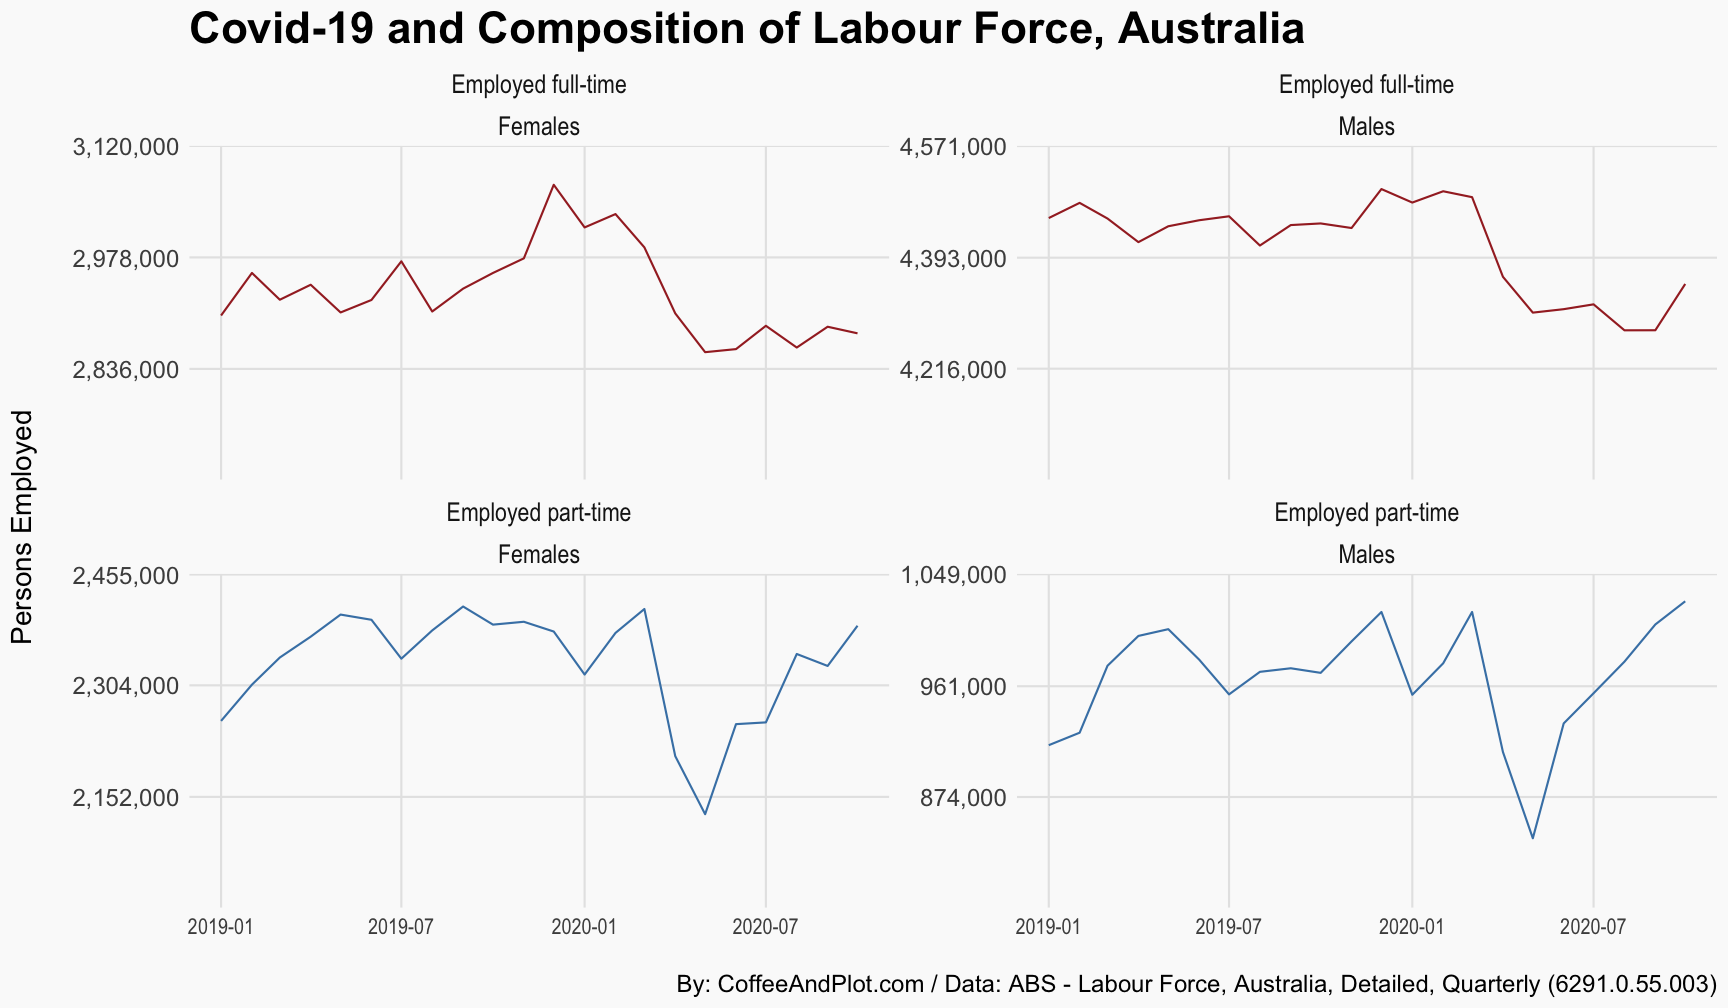
The figure shows the changes in the number of persons employed in Australia by gender and type of employment (full- or part-time) since January 2019.
If you look closely, you can see that almost all the recovery in employment has occured in the part-time jobs and there is no major change across both lines representing the full-time employment for men and women.
This does not mean that all people who had full-time jobs prior to the pandemic are all out of work. For example, it may indicate that some of the previously full-time jobs are now being filled in part-time capacity due to a range of reasons such as insufficient work or employers’ tendency to use schemes such as JobKeeper or JobSeeker.
I will soon explore this issue further using a wider range of data from industries and occupatations.
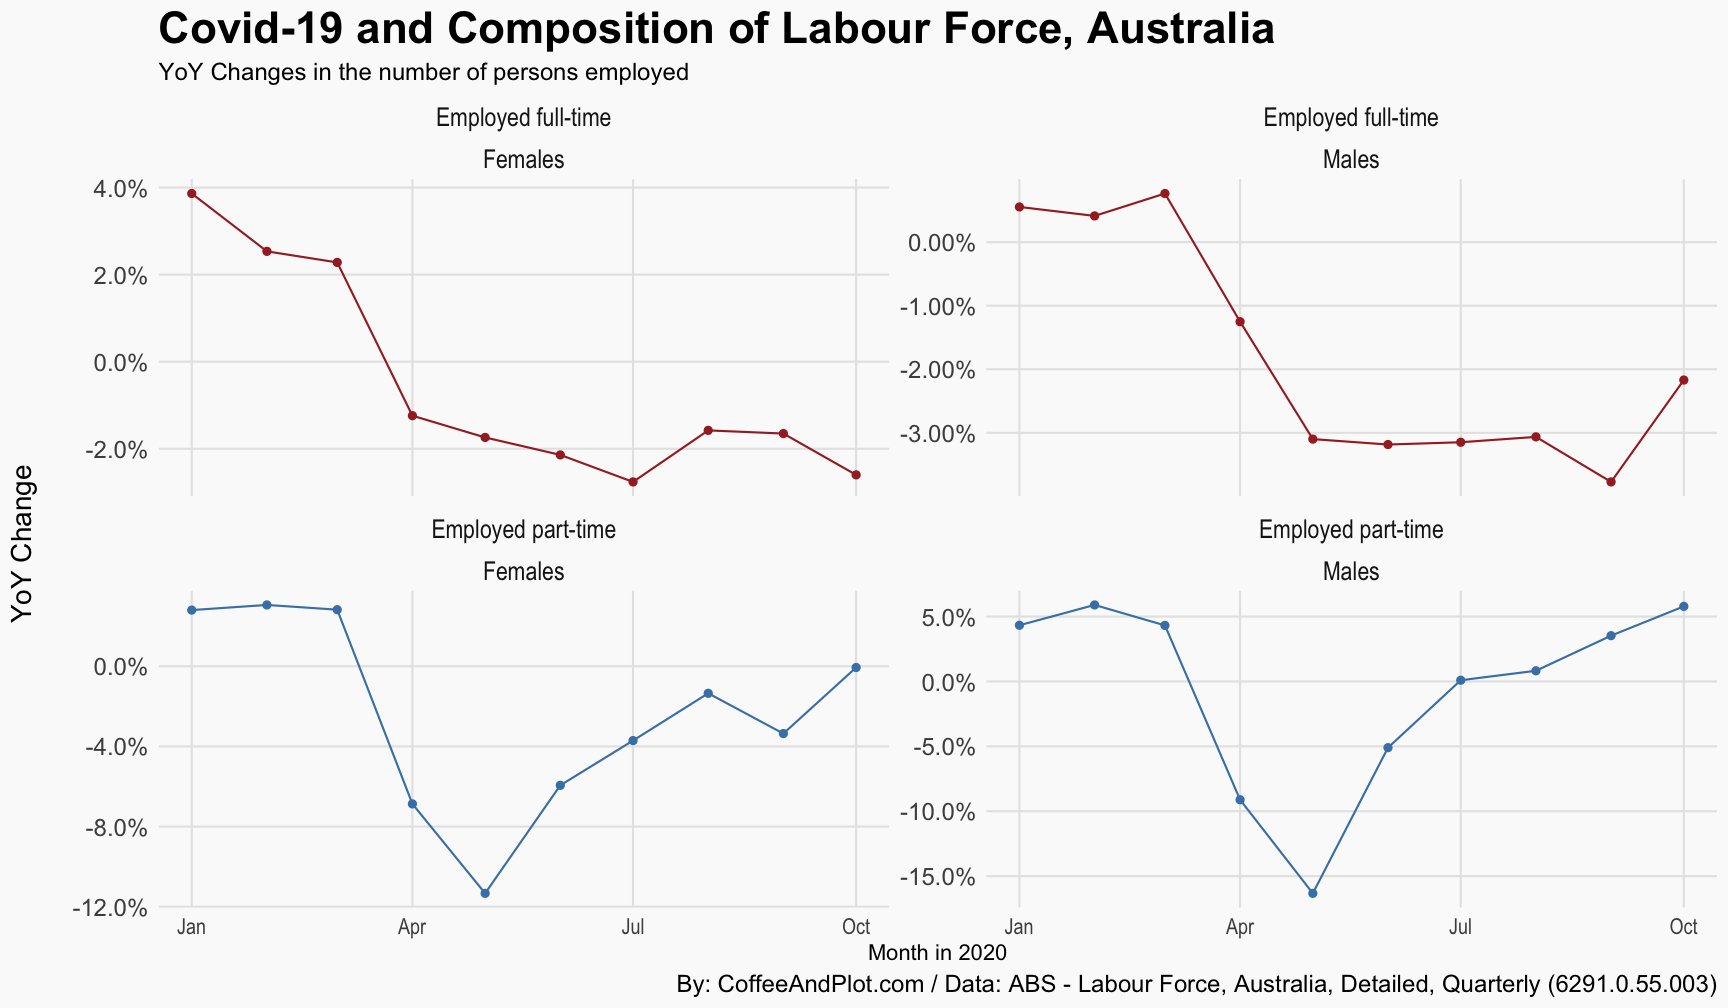
There was a good comment on the fact that the decline in the number of part-time jobs, as a percentage, has been much larger that the number of full-time jobs. I have added a plot here to quantify and explores that further.
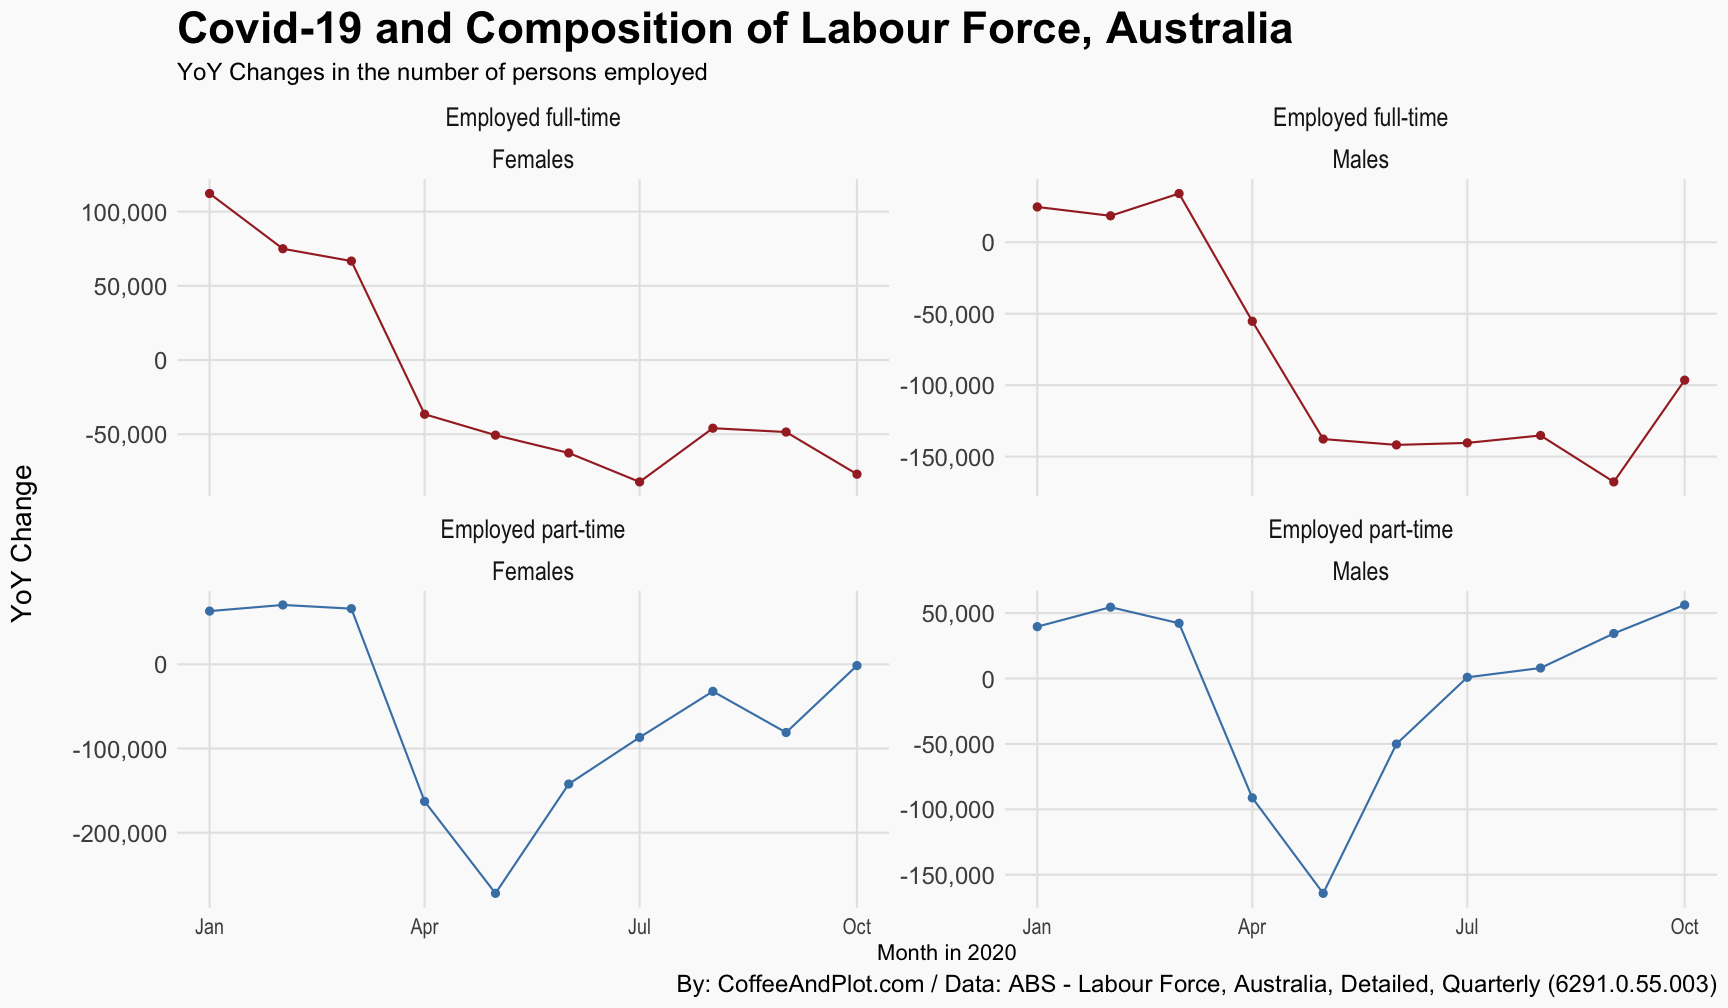
This plot looks at the YoY change in the number of persons employed in each category. The number that you see at each point of time in 2020, for example June 2020, shows the change in that cohorts compared to June 2019.
As the figure shows, number of people employed in part-time jobs declined by about 12% for males and 15% for females in May before starting to recover to 2019 levels for females in October and July for men (and now seeing a 5% yoy growth).
On the other hand, for the full-time trend, other than the recent jump in October for males, there is no sign of recovery in the trend. Looking at this, it is hard to ignore the fact that some kind of substitution might be happening where full-time jobs are being replaced by part-time ones.
One more plot: in case you would like to see the actual yoy change in the number of people employed in each category, have a look at this one.