Impact of Covid-19 Pandemic on Mental Health Service Use in Australia: Insights from Medicare data
Data: Medicare Statistics
Medicare Statistics provides access to data on utilisation of health services that are covered and compensated by Medicate. Here is some information on what is included:
- The figures in the report include only those services that are performed by a registered provider, for services that qualify for Medicare Benefit and for which a claim has been processed by Medicare Australia.
- They do not include services provided by hospital doctors to public patients in public hospitals or services that qualify for a benefit under the Department of Veterans’ Affairs National Treatment Account.
- State/Territory is determined according to the address (at the time of claiming) of the patient to whom the service was rendered.
- Month is determined by the date the service was processed by Medicare Australia, not the date the service was provided.
- Monthly figures may vary due to the varying number of processing days in a month, which depends on the number of days in the month, public holidays, overtime worked etc.
Read more about the data here: Link
Why this data matters?
A recent survey by the ABS showed that the two services that I have focused on here are among the top services used by Austrlians in 2020.
According to the ABS: “The survey asked Australians aged 18 years and over about their use of mental health or support services since 1 March 2020. One in five (19%) Australians reported using at least one mental health or support service since 1 March 2020. The most frequently used services were: GPs for mental health purposes (13%), psychologists, psychiatrists or other mental health specialists (9%), online mental health information (3%), other health workers (3%).”
Mental Health Service Utilisation through TeleHealth
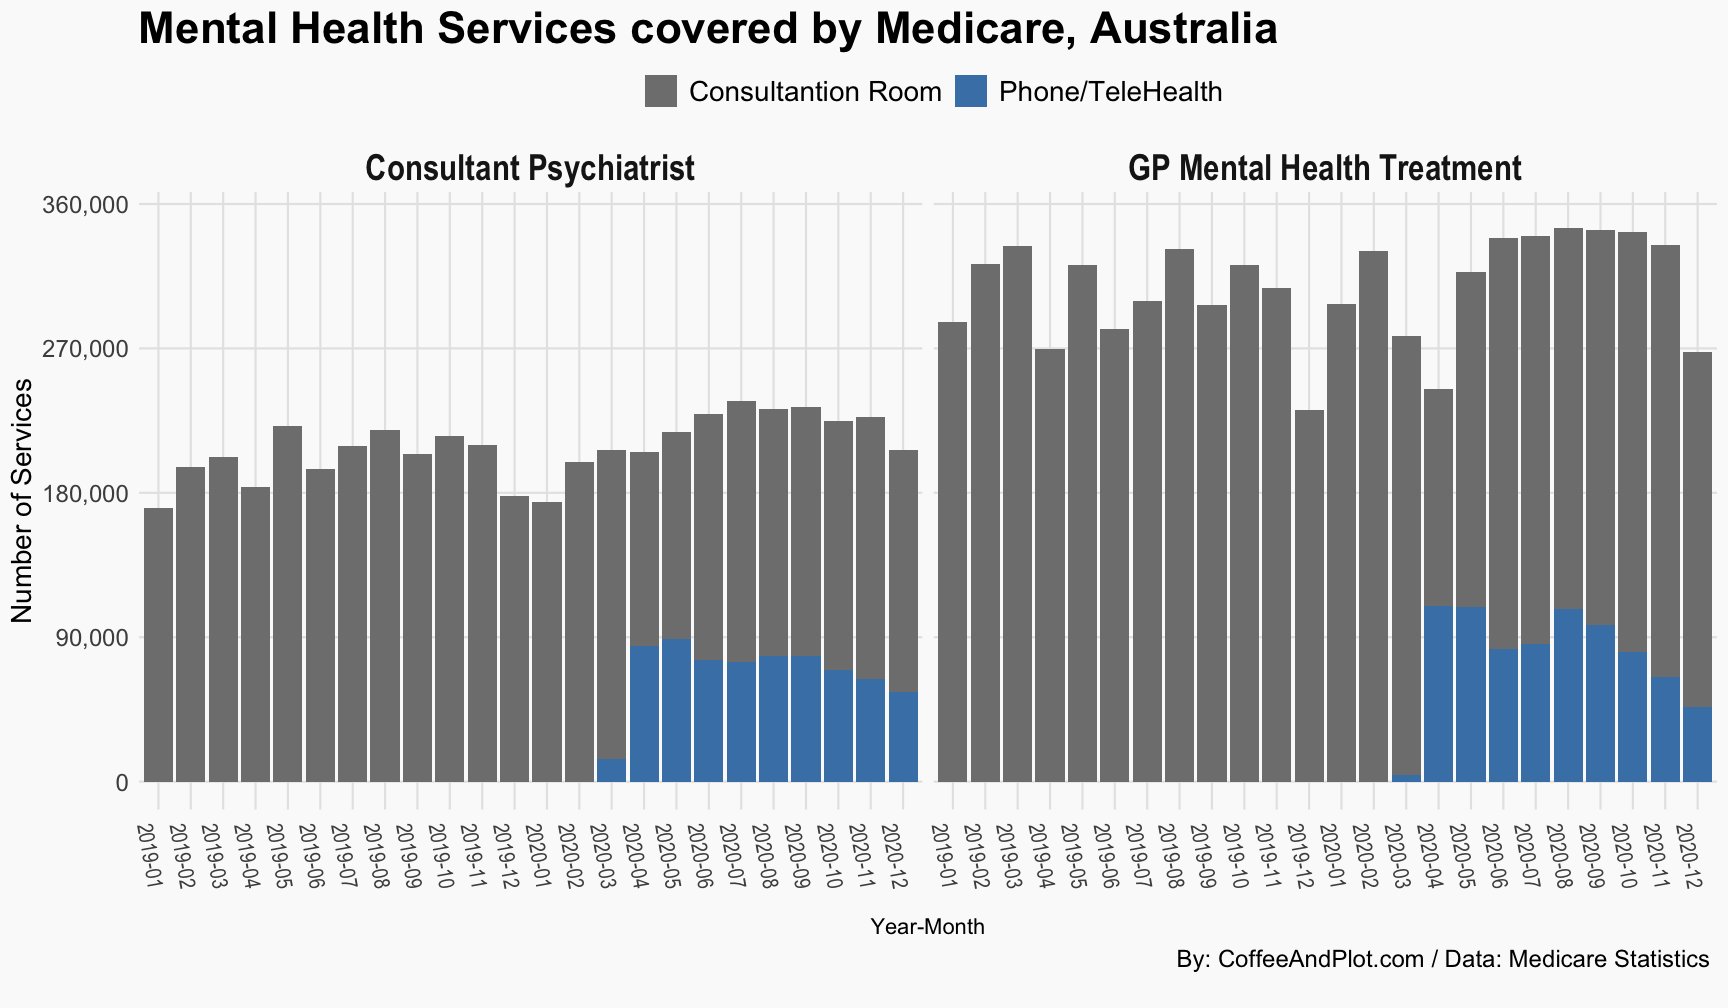
Medicare’s phone and telehealth services played a critical role in ensuring access to mental health services in Australia in 2020. According to the data published by Medicare, a substantial portion of the services provided since April 2020 was not delivered face-to-face. However, following the decline in the number of reported cases of Covid-19 and ease of restrictions, the share of phone/telehealth services declined.
The first figure shows the number of services covered by Medicare in 2019 and 2020. The blue area in the columns since March 2020 shows the number of services that are delivered through phone and telehealth services.
Please notice that this data does not include psychology or other similar services as they are not covered by Medicare.
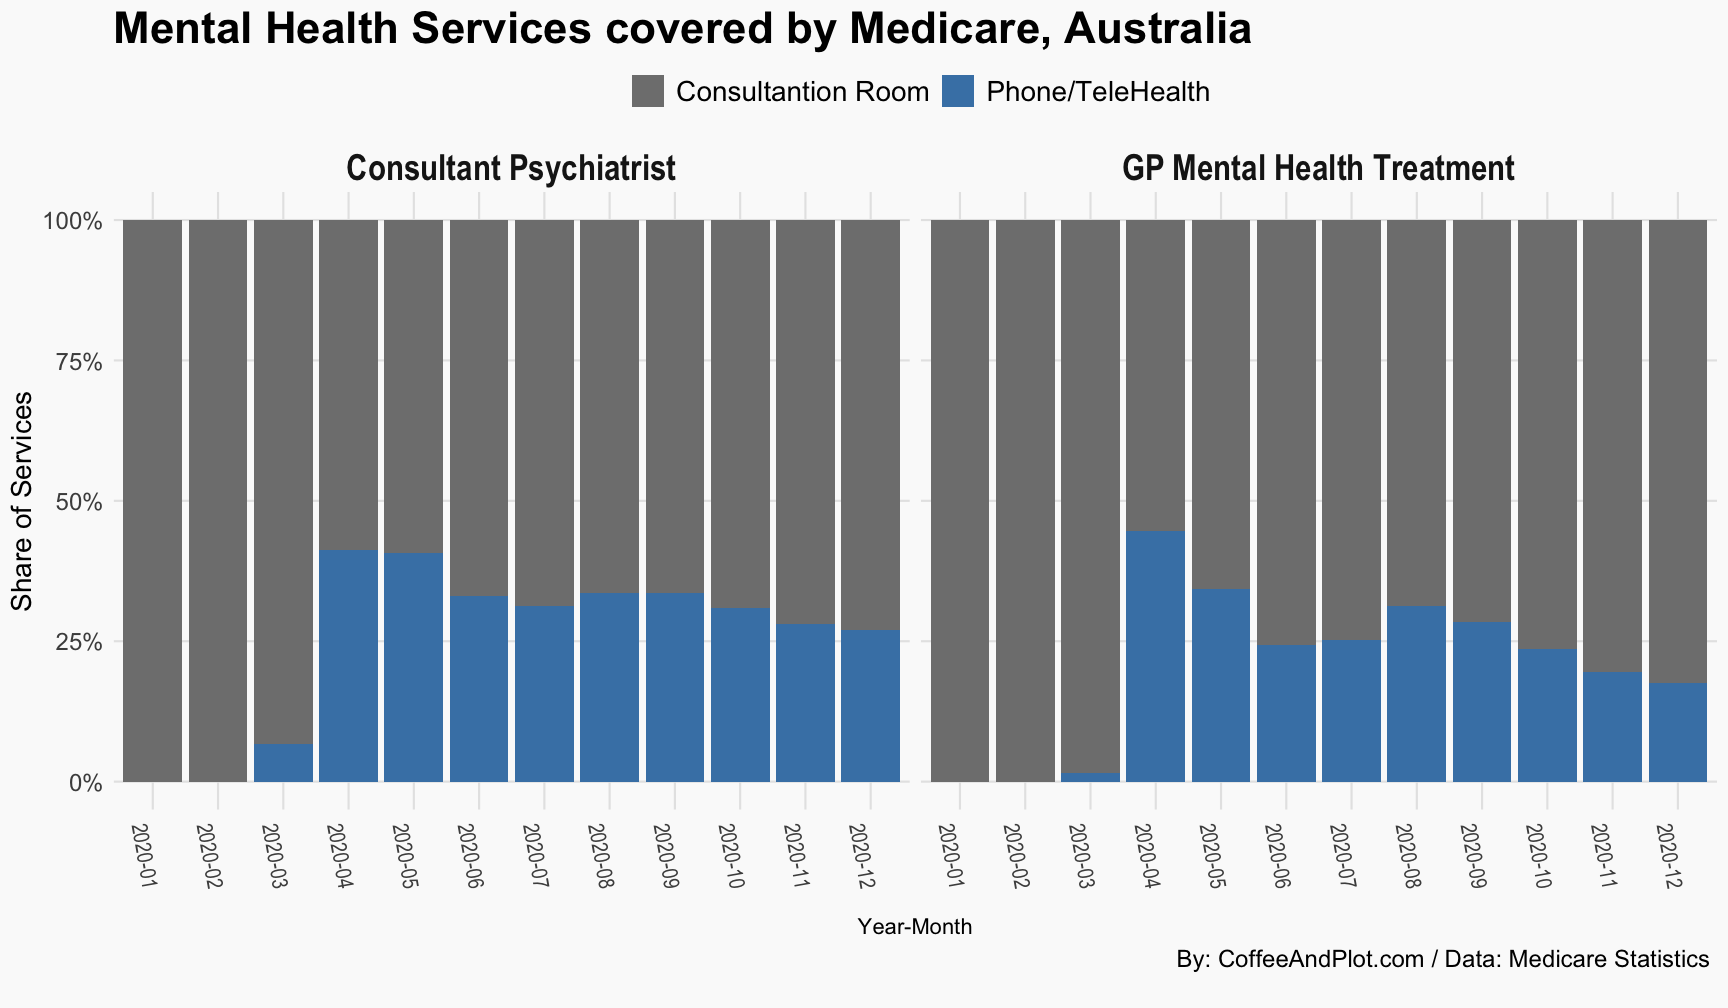
To get a clearer sense of what portion of services have been delivered using telehealth platforms, here I have shown the same data as a share of total services. I have limited the data to 2020 only.
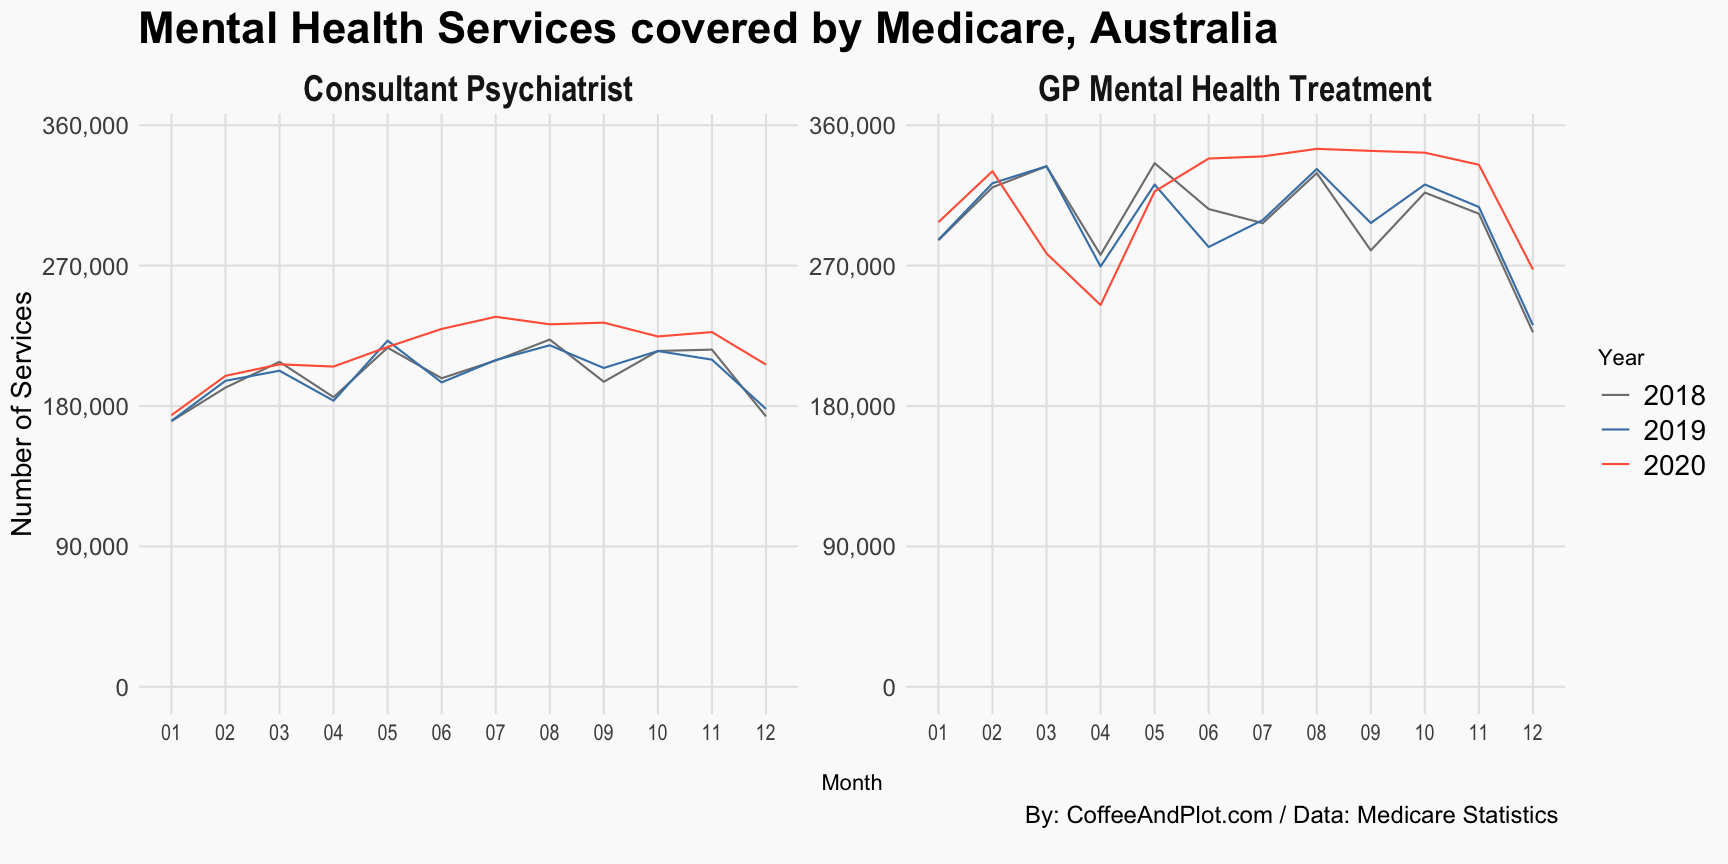
Now, the key question is that if we put all the in-person and telehealth services together, how much service utilisation changed in 2020 compared to the previous years? To show this change, I have here presented the monthly service numbers over the past three years. This helps to control for the seasonality as well.
The figure shows how since June 2020, the total number of services across each category diverged from the historical level and stayed higher for the rest of the year. Overall, Consultant Psychiatrist services increased by about 7% and GP Mental Health Care services increased by ~4.5% in 2020 compared to the average of 2018 and 2019.
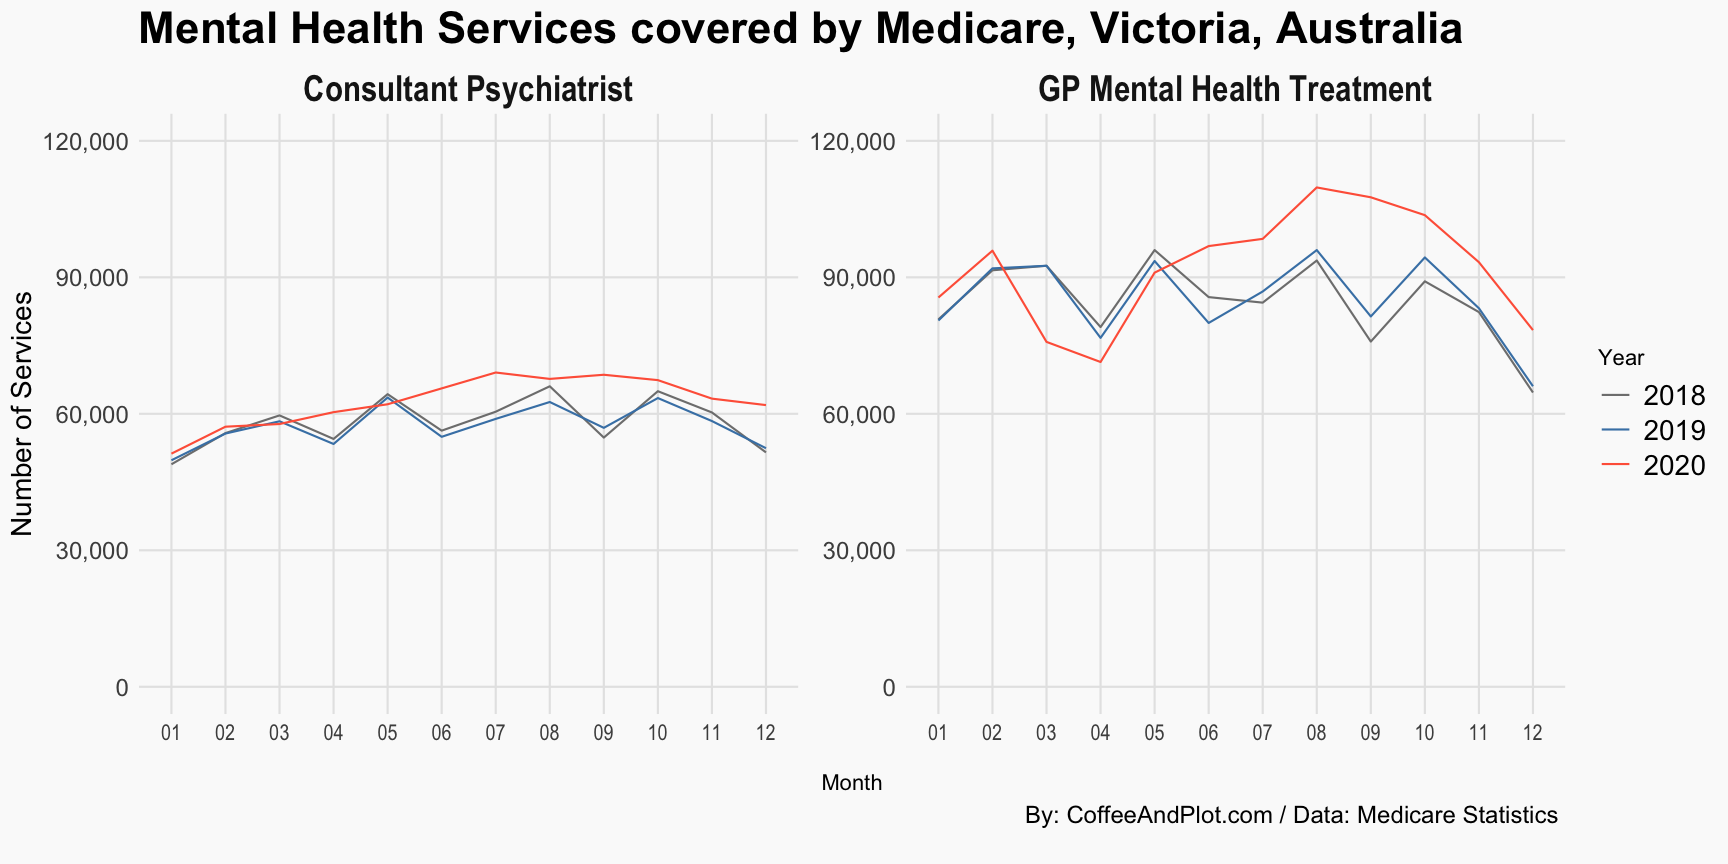
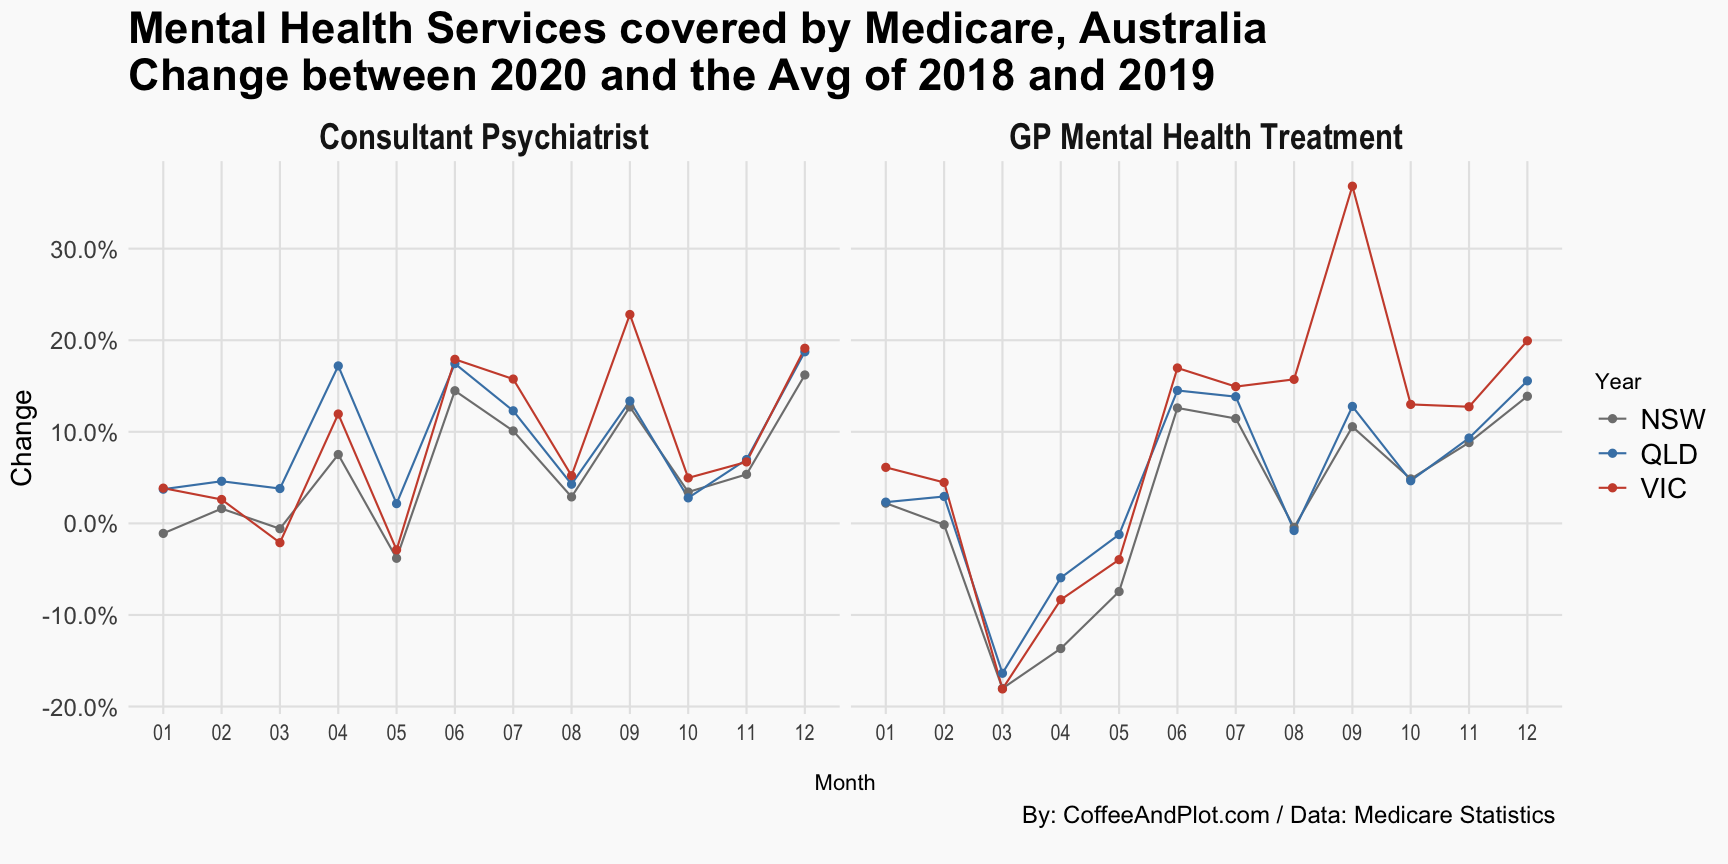
Now, let’s look Victoria where there was a huge debate on the impact of the second wave and the following lockdown on mental health. Looking at this figure, it is clear that the increase in health service use in Victoria, at least visually, seems larger than the trend for the whole country.
But let’s rather than just visually exploring the trend, do some calculations to check if mental health service use patterns were different in Victoria.
To come up with a measure on how much and when mental health service use increased in Victoria compared to the other states, I have measured the change in the number of services between 2020 and the average of 2018 and 2019 across each selected region.
So, if the plot shows 10% for a month for a state, it means that in 2020, during that month there was a 10% increase in the number of services used in that state compared to the average number of services used in 2018 and 2019.
Now, let’s have a look at the figure.
For Consultant Psychiatrist services, when you compare Victoria to the other states, it seems that September 2020 was the only month when the number of services was substantially higher than historical levels.
For GP Mental Health Care services, however, the higher increase is visible all the way through the stage four lockdown from August to October and even in November. BTW, also notice the major decline across all states in March and April during the country-wide lockdown.
Overall, number of services across both categories increased by 8.5% in Victoria in 2020 compared to the average of 2018 and 2019.
I should also mention that some of the increase in Victoria can be due to the fact that the federal government provided additional services for the state in August 2020. According to the press release: “The additional Medicare support will allow people in eligible areas who have used their 10 sessions to continue to receive mental health care from their psychologist, psychiatrist, GP or other eligible allied health worker.”
If you would like the numbers for other states and territories, here is a dynamic plot where you can select what you are interested in using the figure legend. Just click on the name of the region that you would like to select/remove.